Using Network Traffic Analytics
The ‘Overview’ tab displays the general summary of network traffic data.
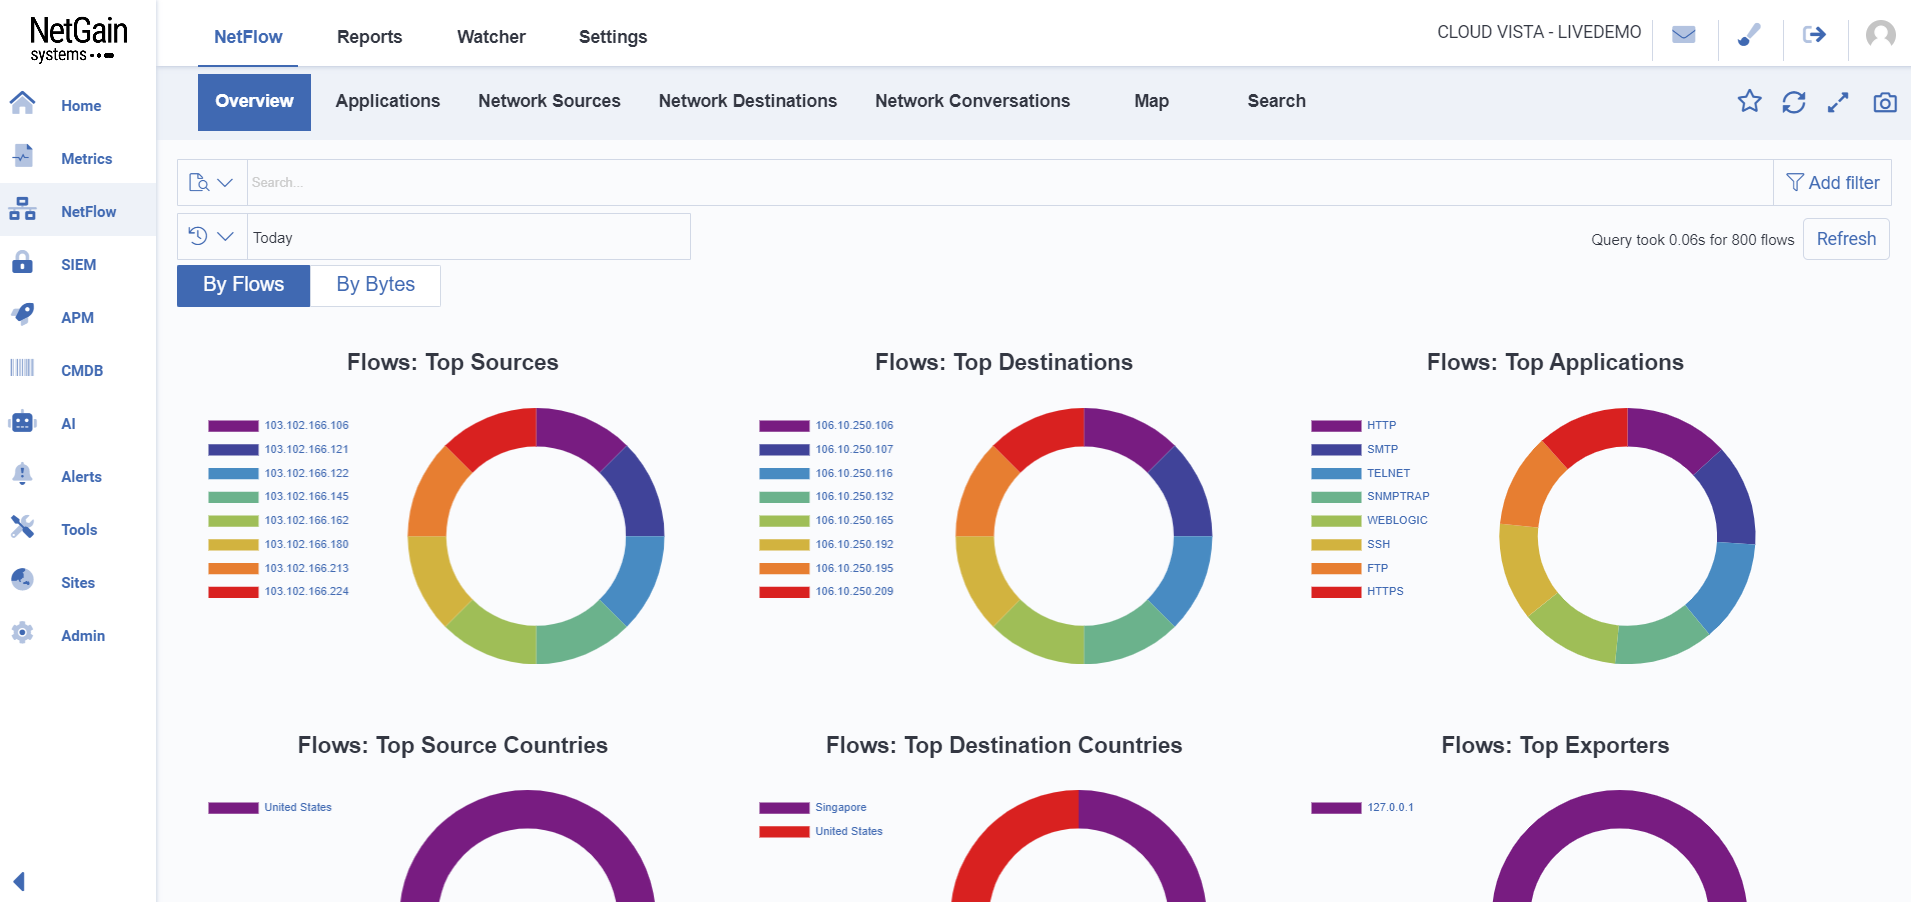
This overview can gain insights into the network usage patterns and detect any anomalies.
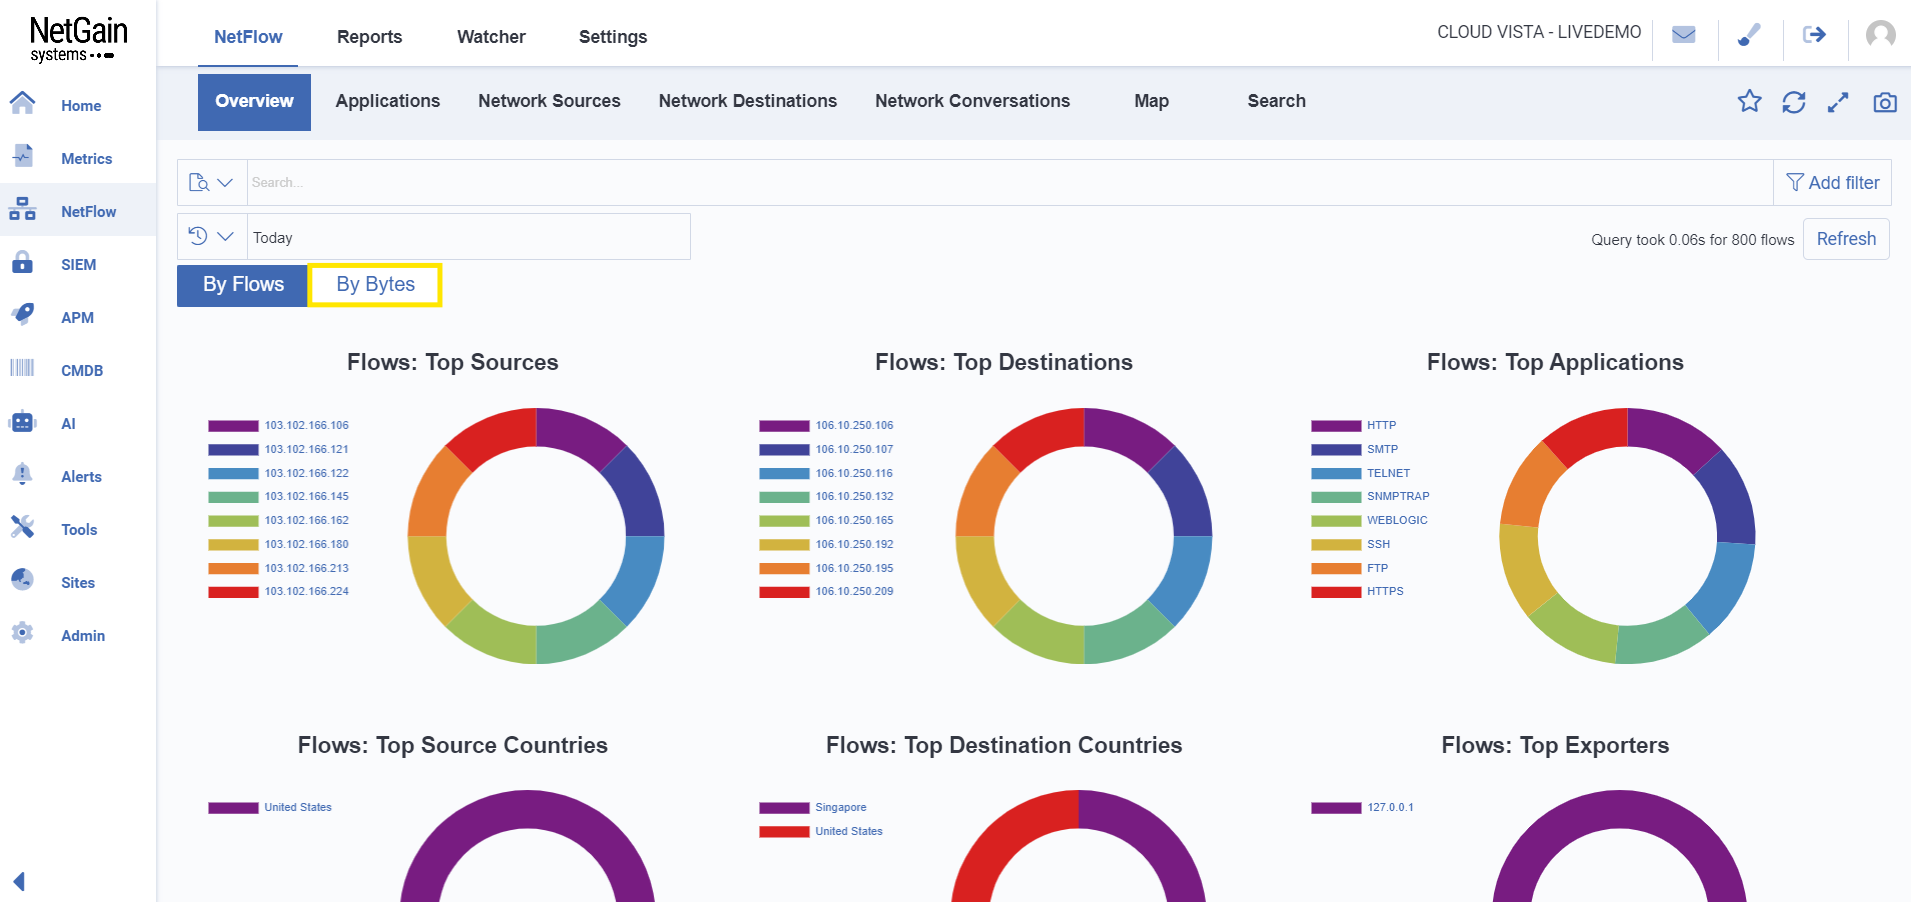
Click on  to view network data by Bytes.
Applications
The ‘Applications’ tab displays a detailed view of the network traffic categorized by different applications.
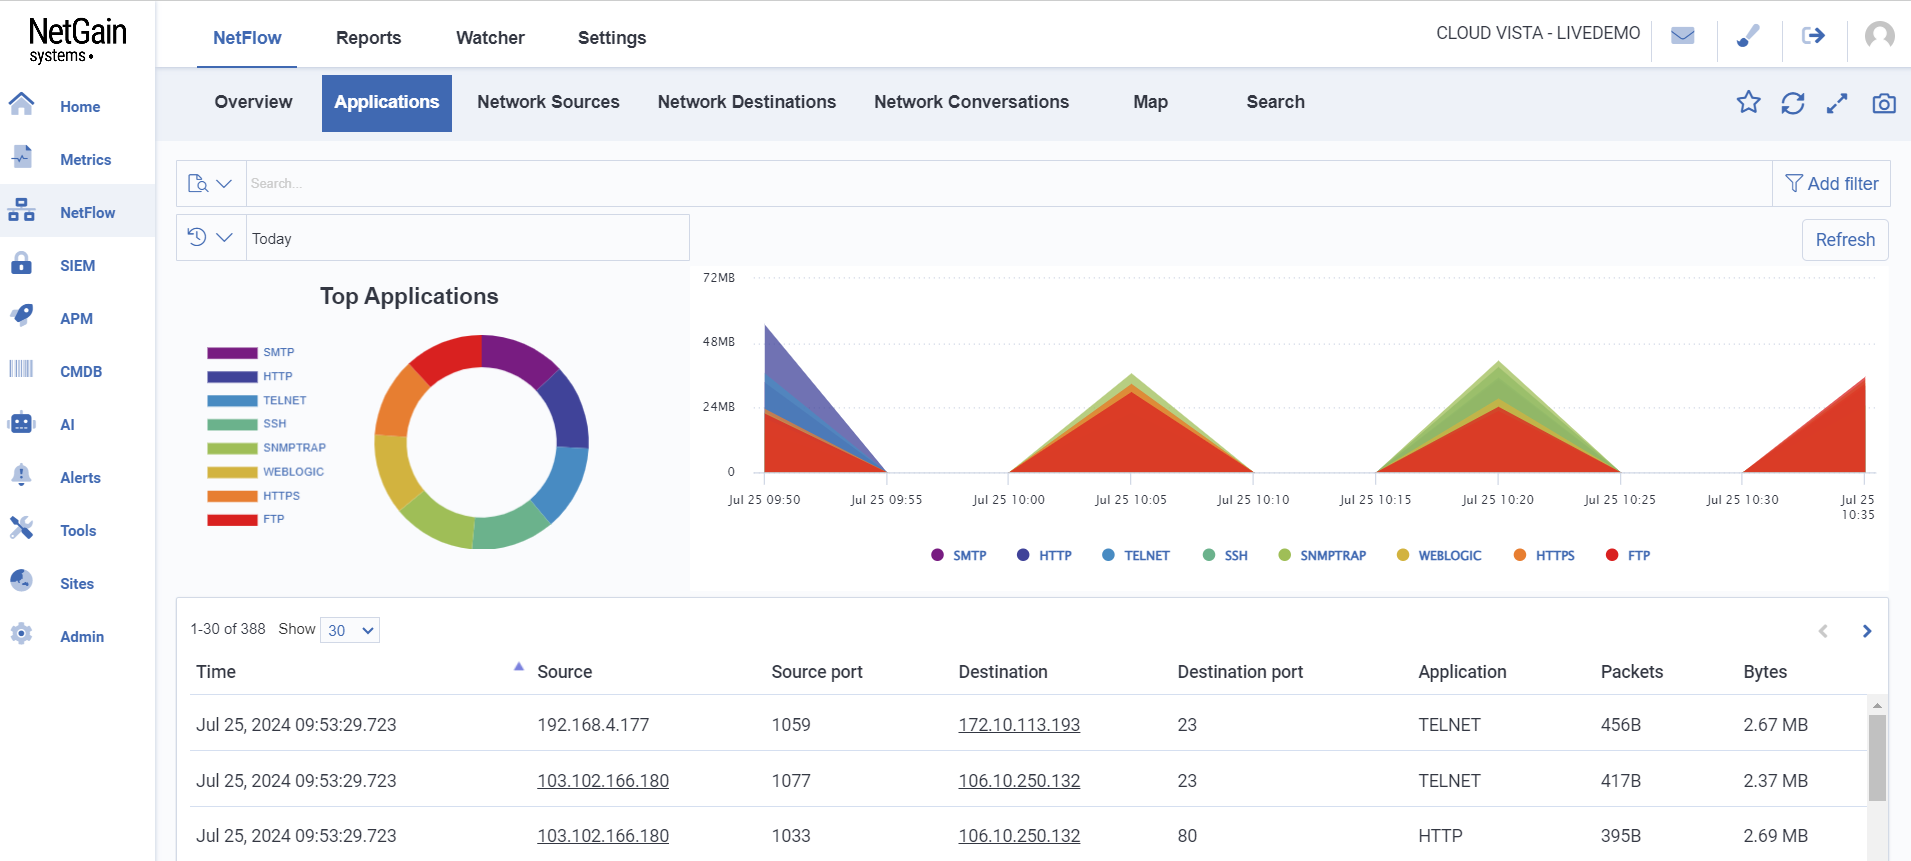
- The pie chart displays the distribution of network traffic among the top applications.
- The graph displays the traffic trend over time for the top applications. The x-axis represents the time, while the y-axis represents the volume of traffic.
- The table displays the detailed information about the individual traffic flows.
Network Sources
The ‘Network Sources’ tab displays a detailed analysis of the top source IP addresses generating network traffic.
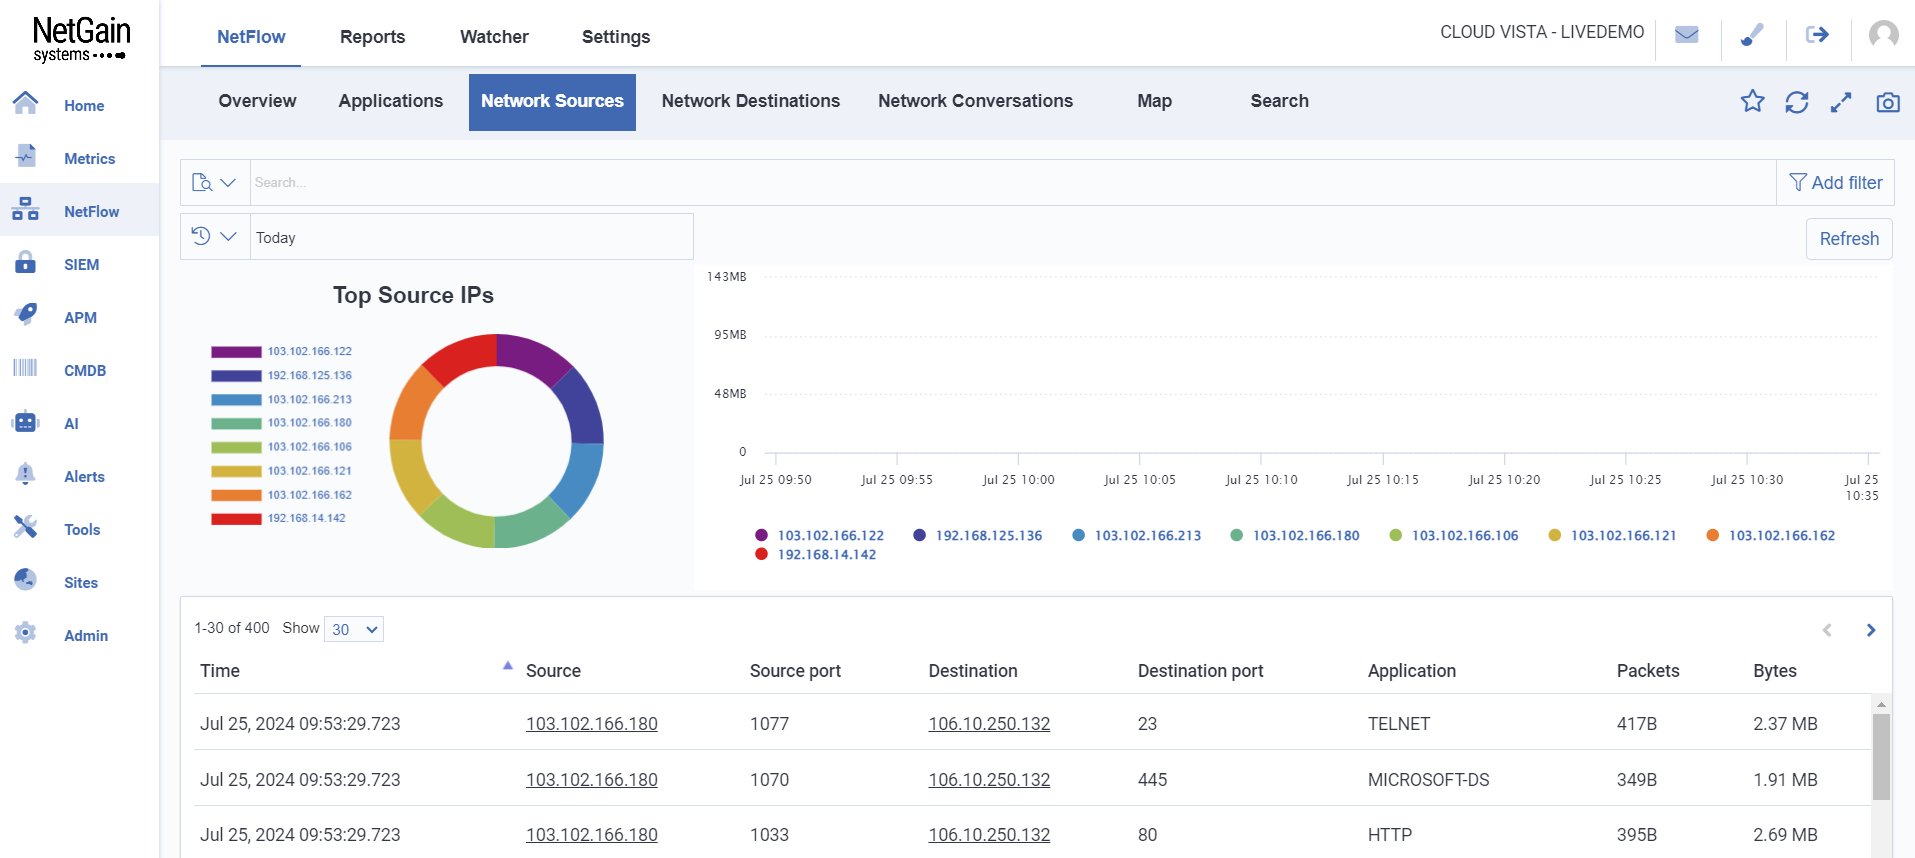
- The pie chart displays the top source IP addresses contributing to network traffic.
- The line graph displays the traffic trends over time for the top source IP addresses.
- The table displays the detailed breakdown of network traffic for each source IP address.
Network Destinations
The ‘Network Destinations’ tab displays an analysis of the top IP addresses receiving network traffic.
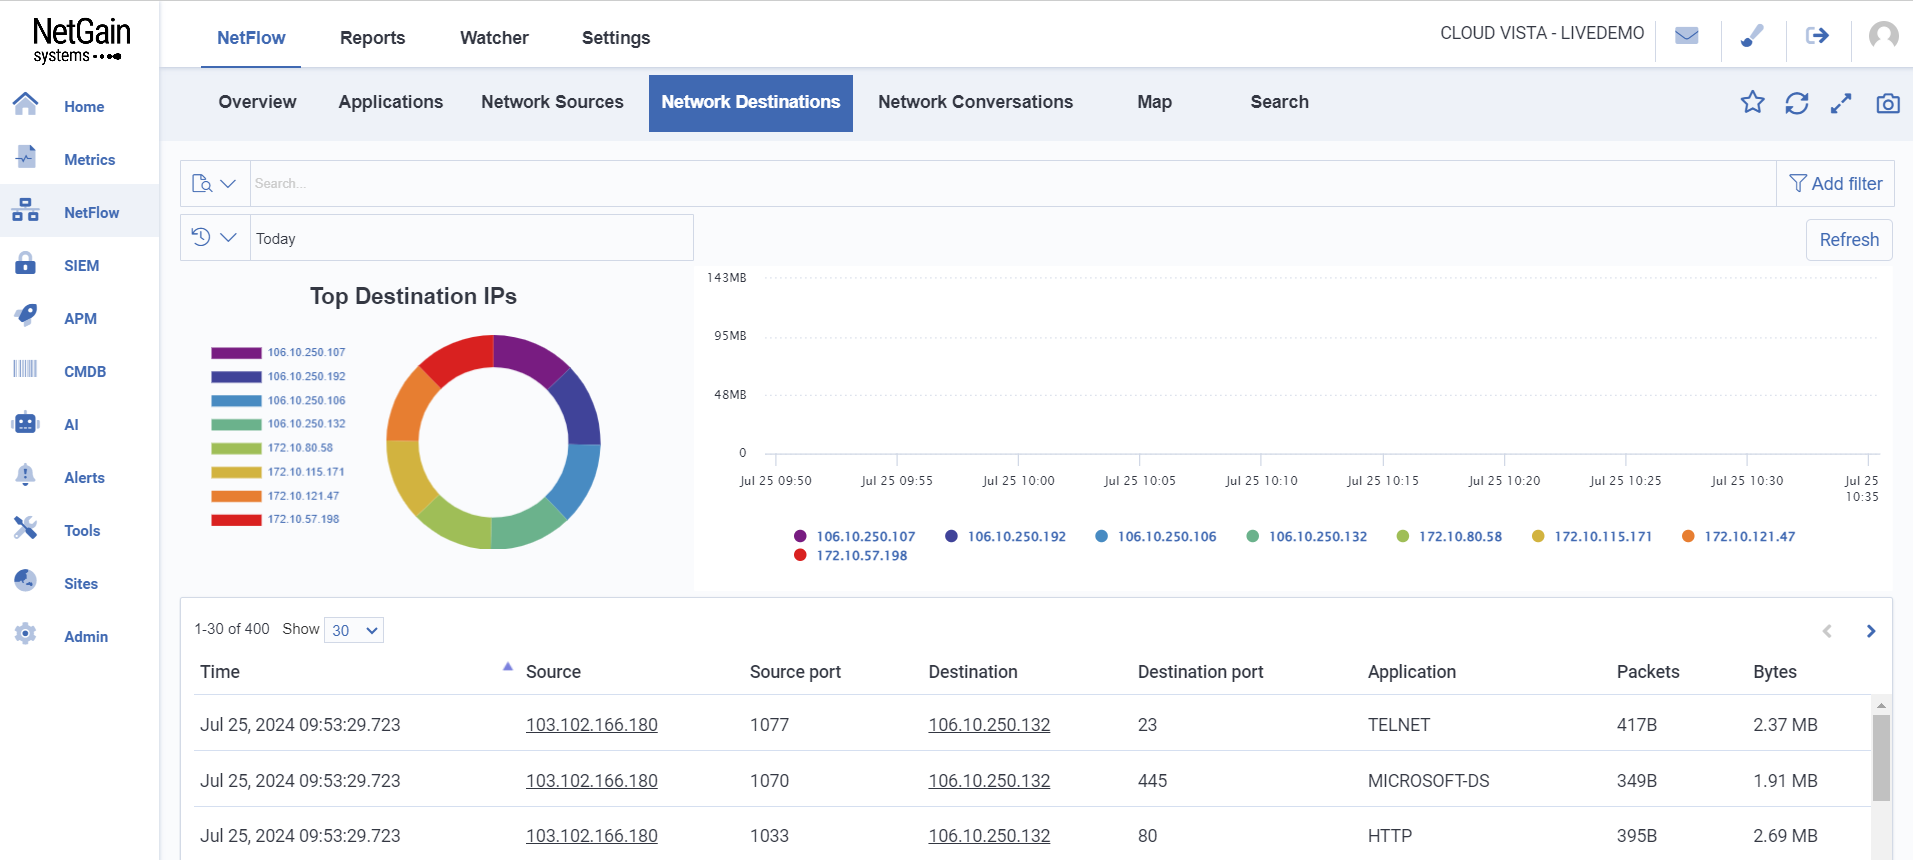
- The pie chart displays the top destination IP addresses receiving the most network traffic.
- The line graph displays the traffic trends over time for the top destination IP addresses.
- The table displays a detailed breakdown of network traffic for each destination IP address.
Network Conversations
The ‘Network Conversations’ tab displays a view of the top conversations between source and destination IP addresses in the network.
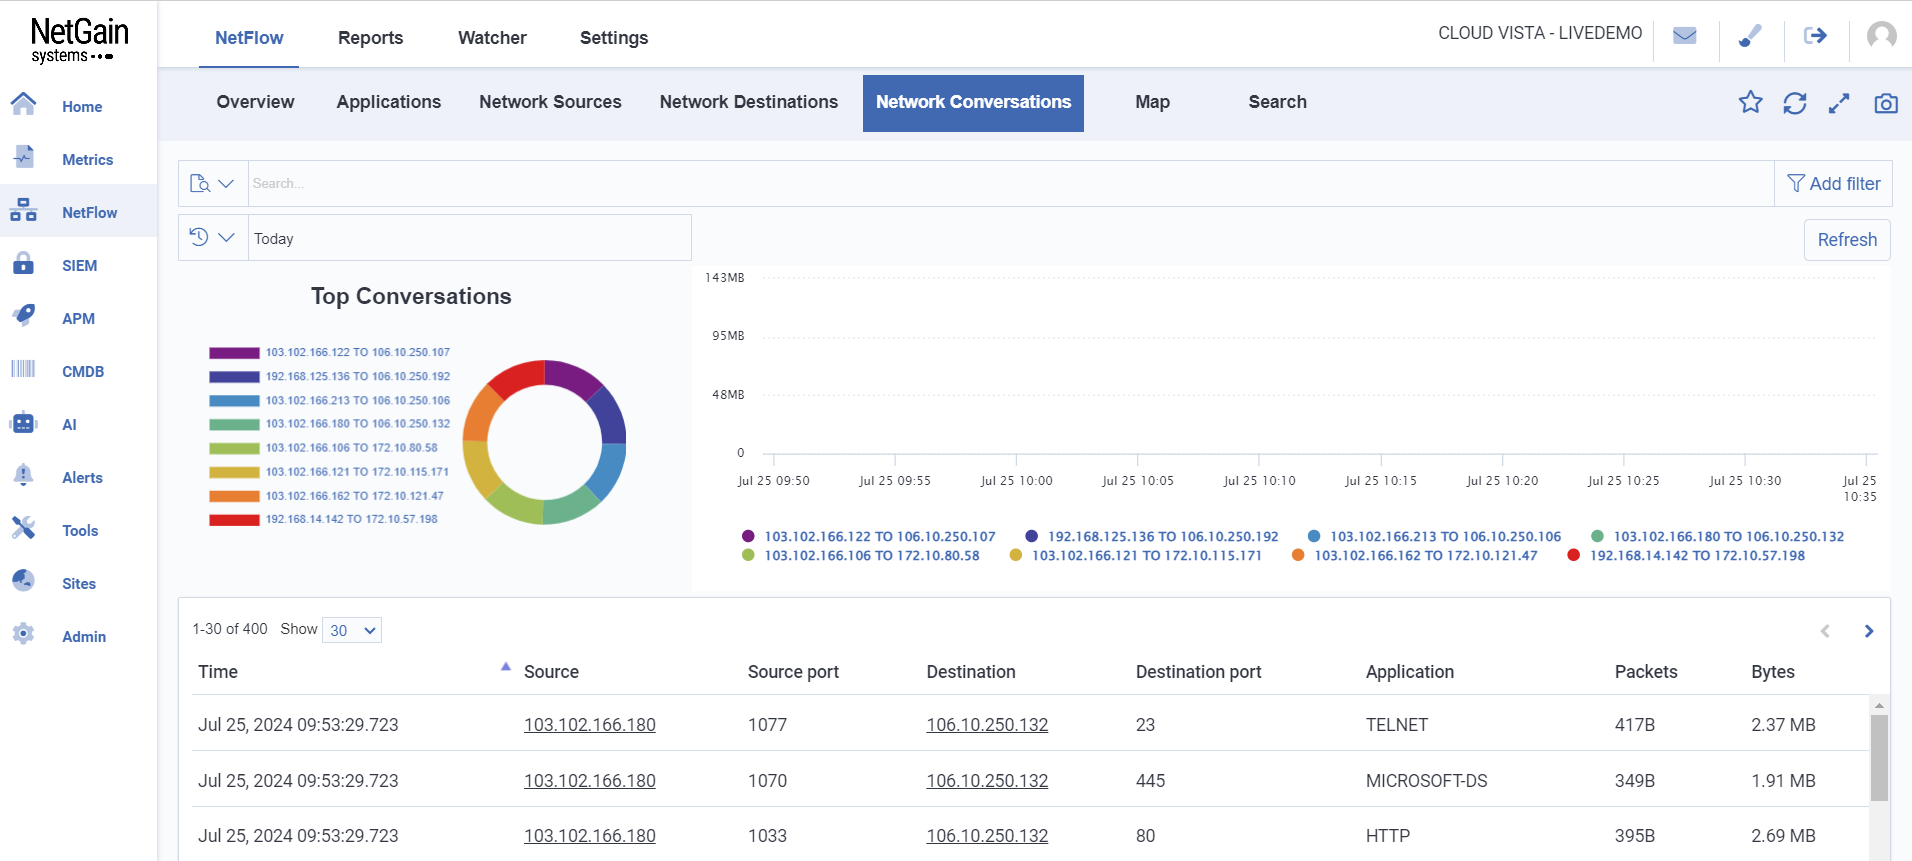
- The pie chart displays the top conversation between IP addresses.
- The line graph displays the traffic trends over time for the top conversations.
- The table displays a detailed breakdown of each network conversation.
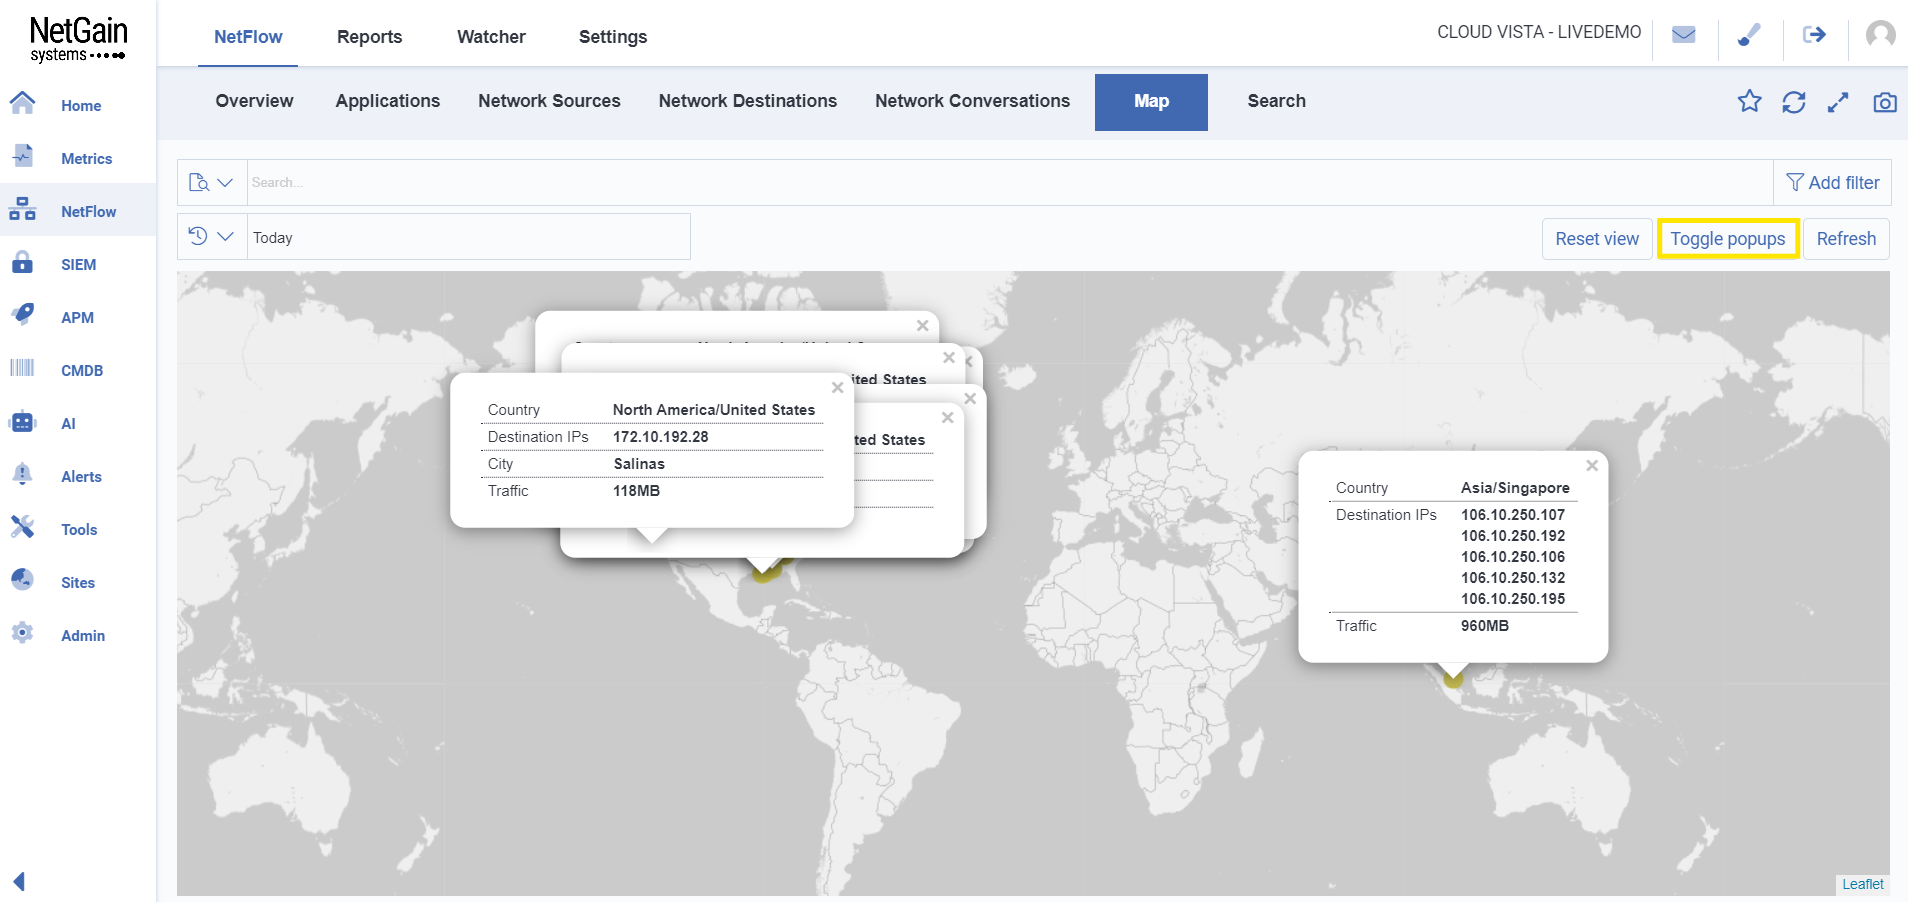
Map
Map is used for displaying and analyzing network traffic flows between geographic locations.
The ‘Map’ tab displays a global network traffic visualization.
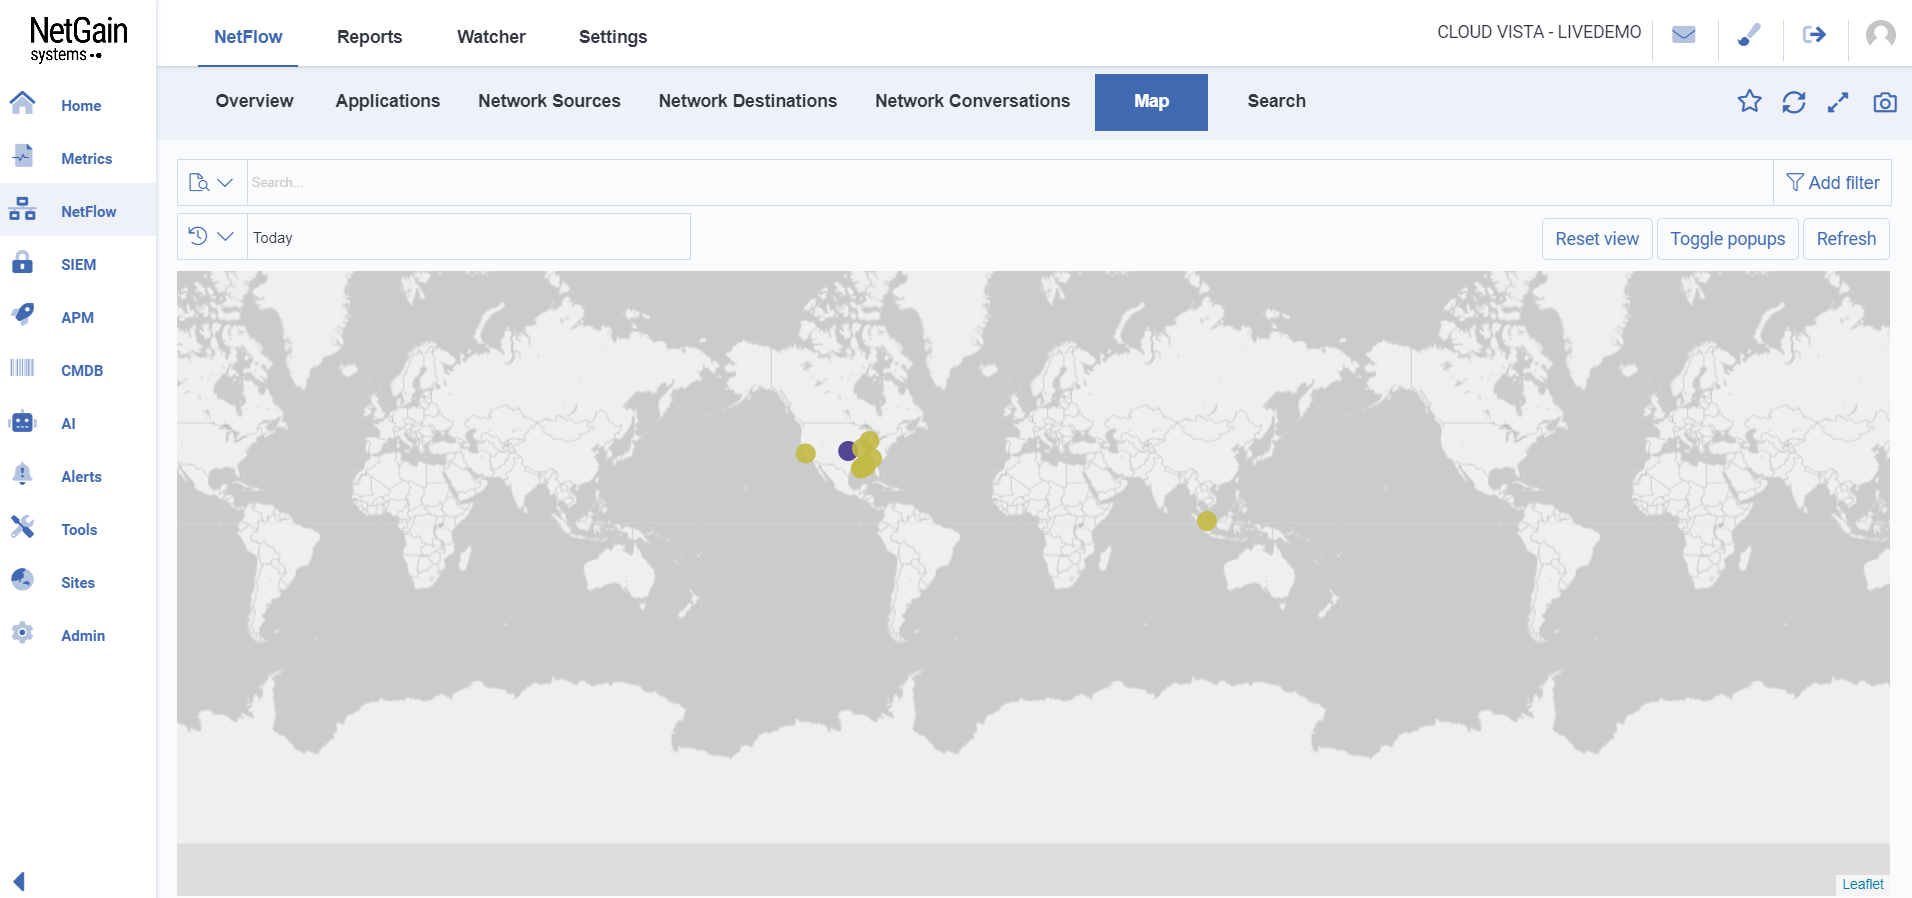
Click on  to view details.
Search
To use the NetFlow feature, click on <NetFlow> on the Left Navigation Bar, then <NetFlow> at the Top Navigation Bar.
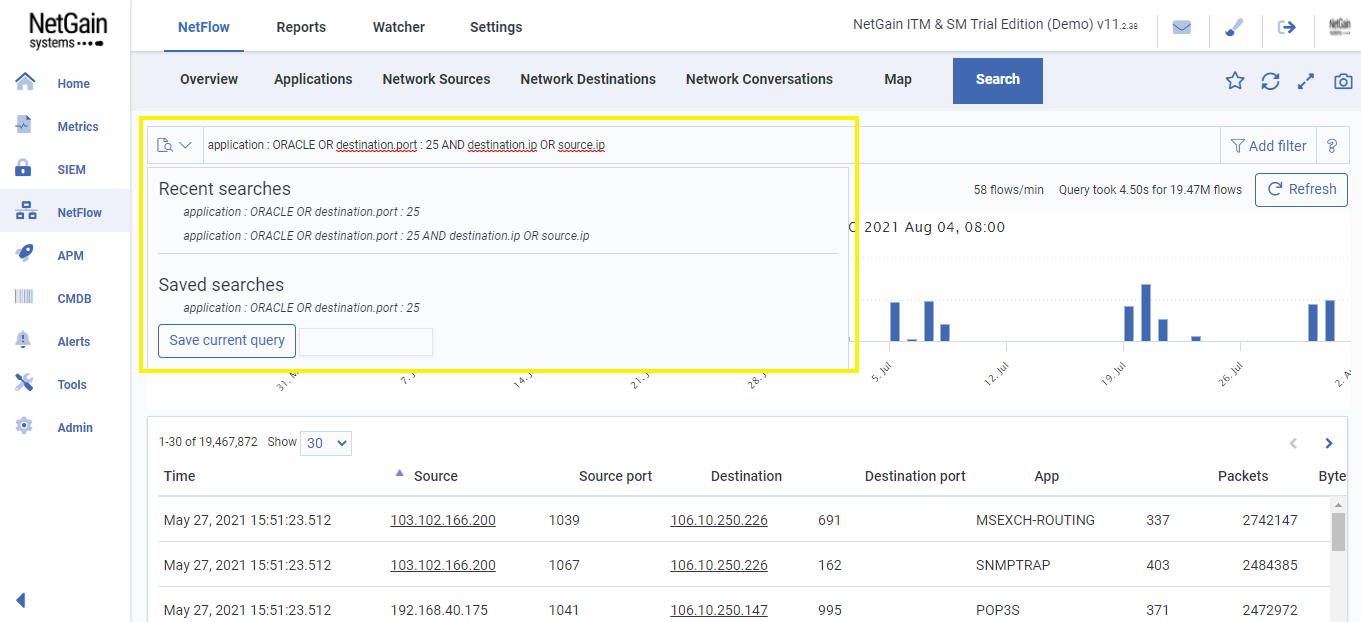
Click on <Search> to search and query different network flows. Click on <?> for help in performing a search.
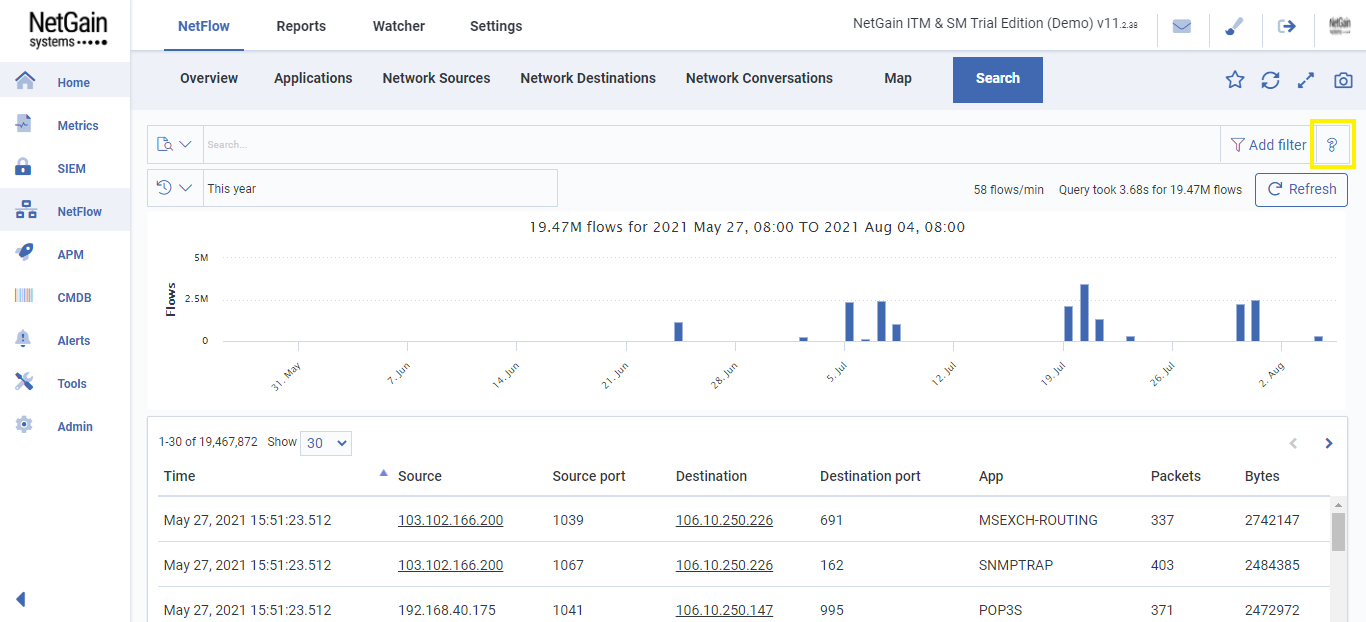
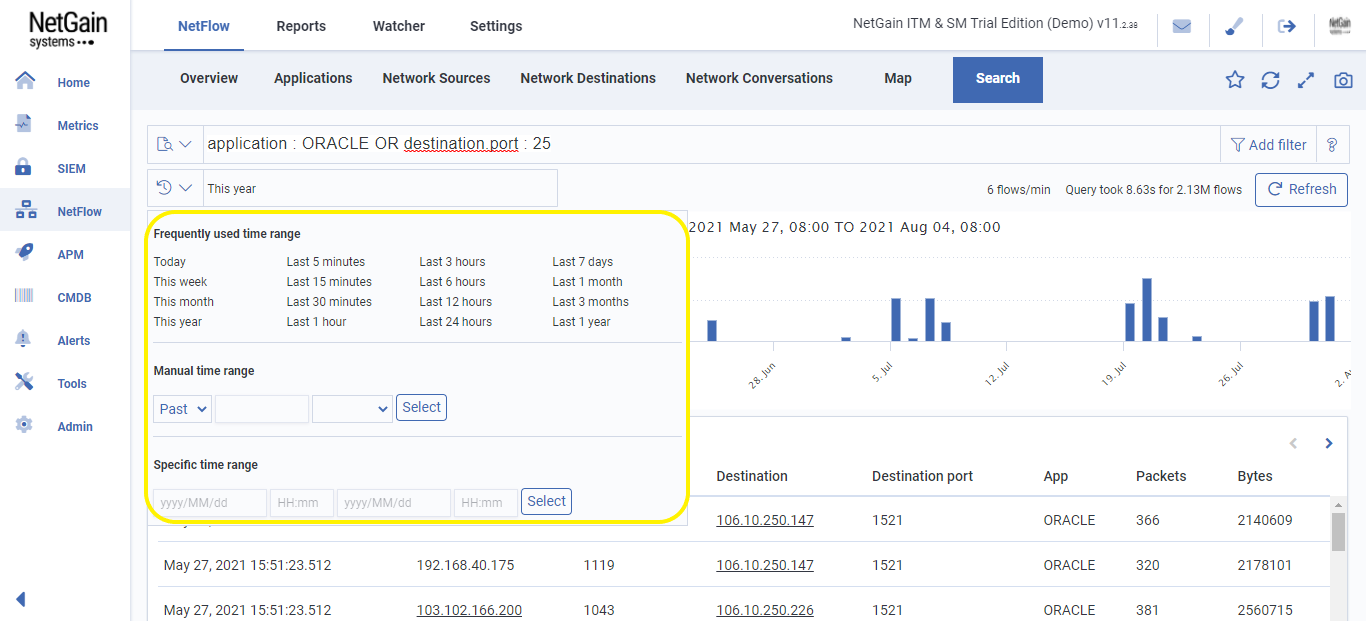
You can see the most recent search query and specify the time range.

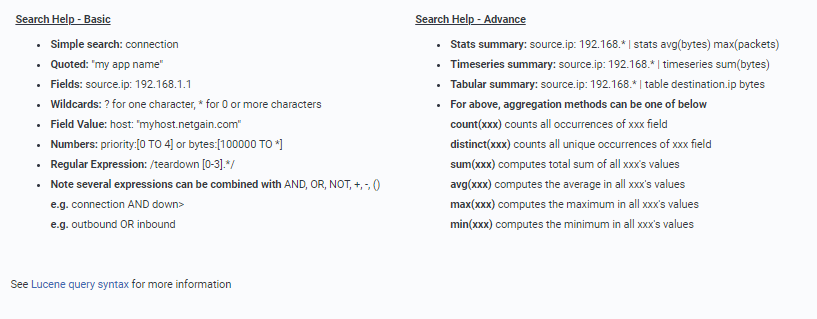
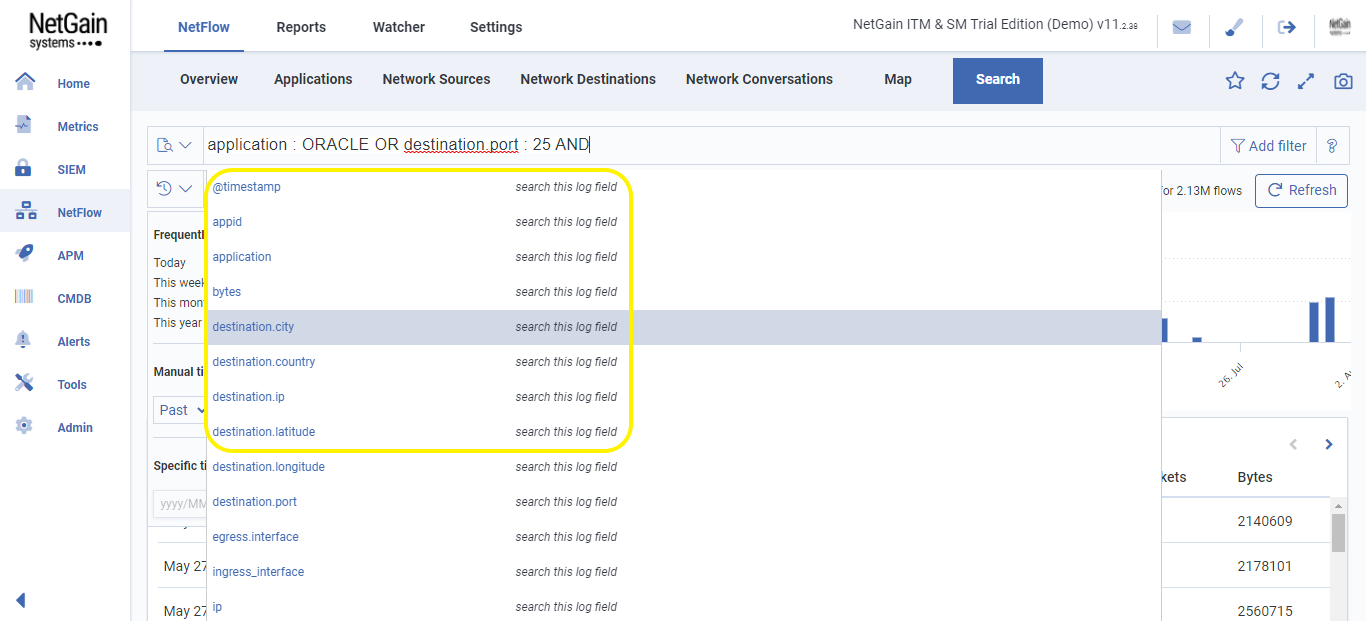
You can find flow information quickly with Text Box Search. To search for any desired information, enter the information you want to search, such as Text, Numeric, Fields, Wildcards, or others in the Text Box Search.
Example of search: application : ORACLE OR destination.port : 25
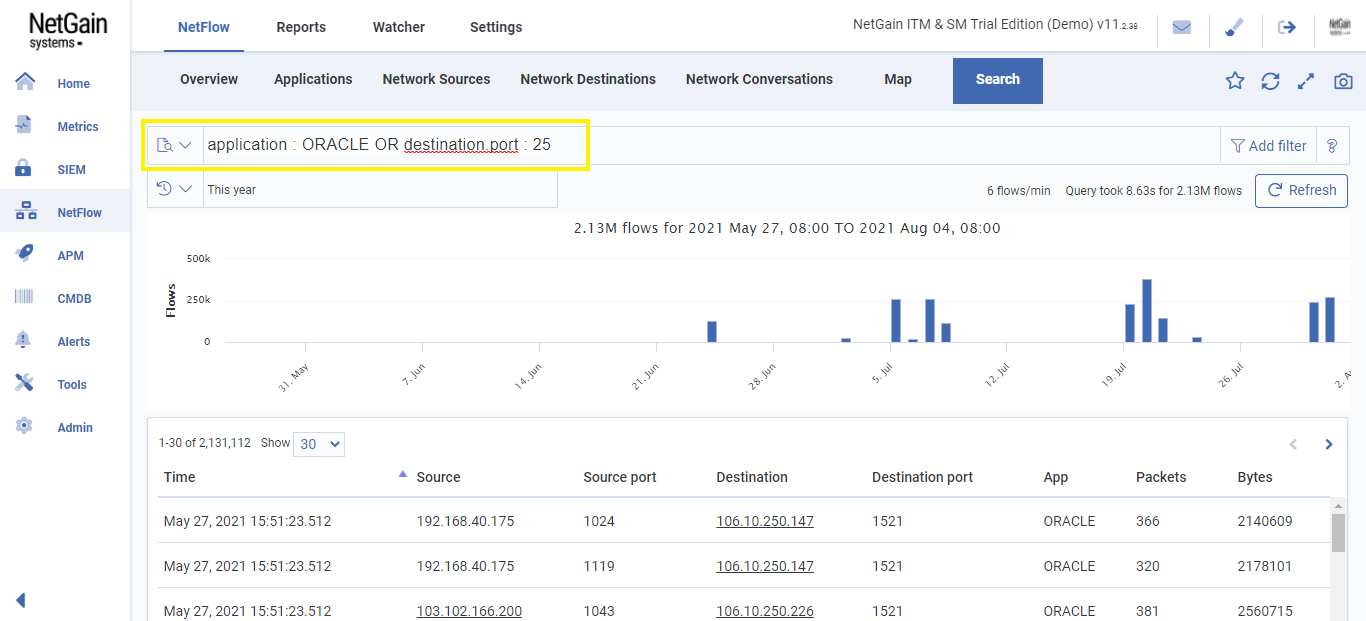
You can change the time range of the data to be searched.
When you enter search terms, smart suggestions show possible search fields.
You can display “Recent searches” and “Save current query” for future searches.