| Logs |
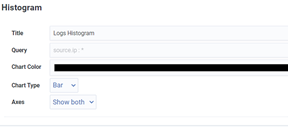
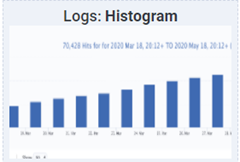
Histogram |
Query string driven. Shows logs histogram by different aggregation methods in the form of bar, line and area graphs.
  |
| Logs |
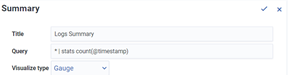
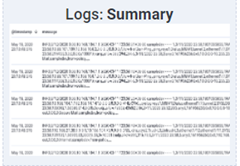
Summary |
Query string driven. Shows logs summary by different aggregation methods in the form of bar, pie, gauge, horizontal bar and line graphs.
  |
| Logs |
SIEM Events |
Shows count of current security events generated |
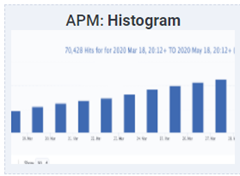
| APM |
Histogram |
Query string driven. Shows APM histogram by different aggregation methods in the form of bar, line and area graphs
 |
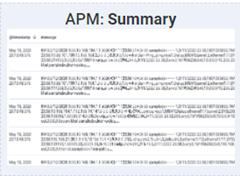
| APM |
Summary |
Query string driven. Shows APM summary by different aggregation methods in the form of bar, pie, gauge, horizontal bar and line graphs.
 |
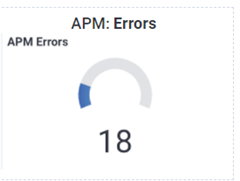
| APM |
Errors |
Shows the current count of APM transaction errors
 |
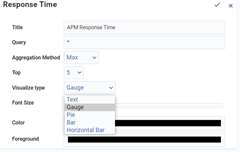
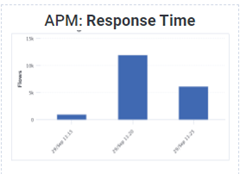
| APM |
Response Time |
Query string driven. Shows APM response time in the form of gauge, bar, pie, gauge, horizontal bar graphs.
  |
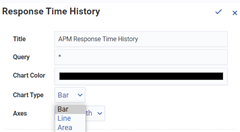
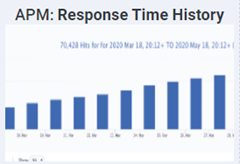
| APM |
Response Time History |
Query string driven. Shows APM response time history trend in the form of bar, line and area graphs.
  |
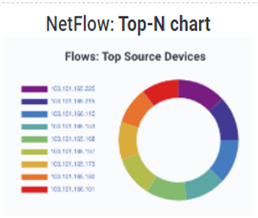
| NetFlow |
TopN |
Shows the Top N results in Pie chart for NetFlow related data: source.ip, destination.ip, application
 |
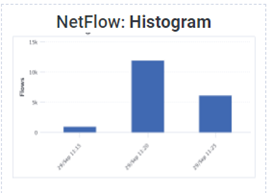
| NetFlow |
Histogram |
Query string driven. Shows NetFlow histogram in the form of bar, line and area graphs.
 |
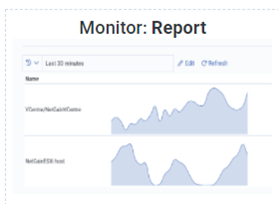
| Monitor (Metrics) |
Report |
Provides graphical representation of specified monitor metrics
 |
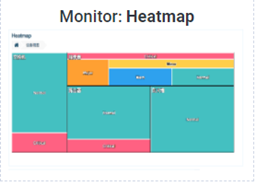
| Monitor (Metrics) |
Heatmap |
Shows the alarm heatmap by device category
 |
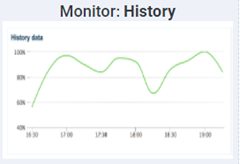
| Monitor (Metrics) |
History |
Shows the history data and trend for a single monitor value
 |
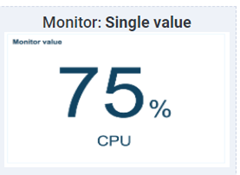
| Monitor (Metrics) |
Single Value |
Shows a single monitor value
 |
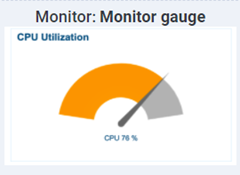
| Monitor (Metrics) |
Monitor Gauge |
Shows a monitor value in the form of a gauge
 |
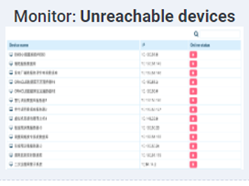
| Monitor (Metrics) |
Unreachable Devices |
Shows a list of monitored devices that cannot be reached
 |
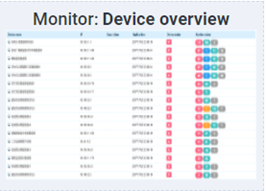
| Monitor (Metrics) |
Device Overview |
Shows an overview of the monitored devices
 |
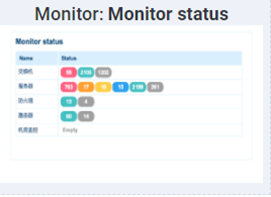
| Monitor (Metrics) |
Monitor Status |
Shows the monitor status
 |
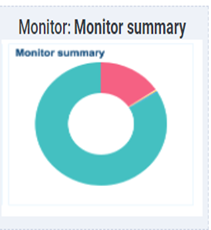
| Monitor (Metrics) |
Monitor Summary |
Shows a summary of the monitor status.
 |
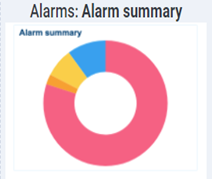
| Alarm (Alerts) |
Alarm Summary |
Shows a summary of the current alarms
 |
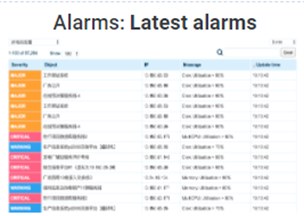
| Alarm (Alerts) |
Latest Alarms |
Shows the current alarms
 |
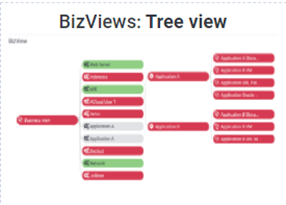
| Bizviews |
Tree View |
Shows Bizview in tree view
 |
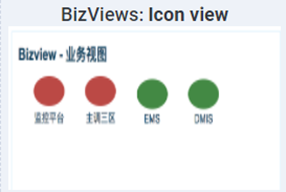
| Bizviews |
Icon View |
Shows Bizview in icon view
 |
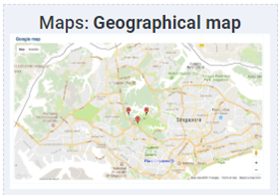
| Maps |
Geographical Map |
Shows the device status in a geographical map
 |
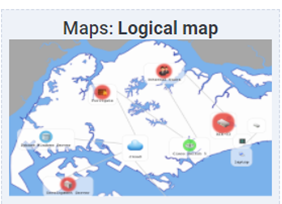
| Maps |
Logical Map |
Shows the device status in a logical map
 |
| Tools |
IFrame |
Lets you integrate the Dashboard with a web supported iframe
 |
| Tools |
Clock |
Displays the date and time
 |
| Tools |
Banner |
Lets you create a banner message
 |