Emedge Sites
Sites are used for monitoring and managing distinct environments or deployments within the organization.
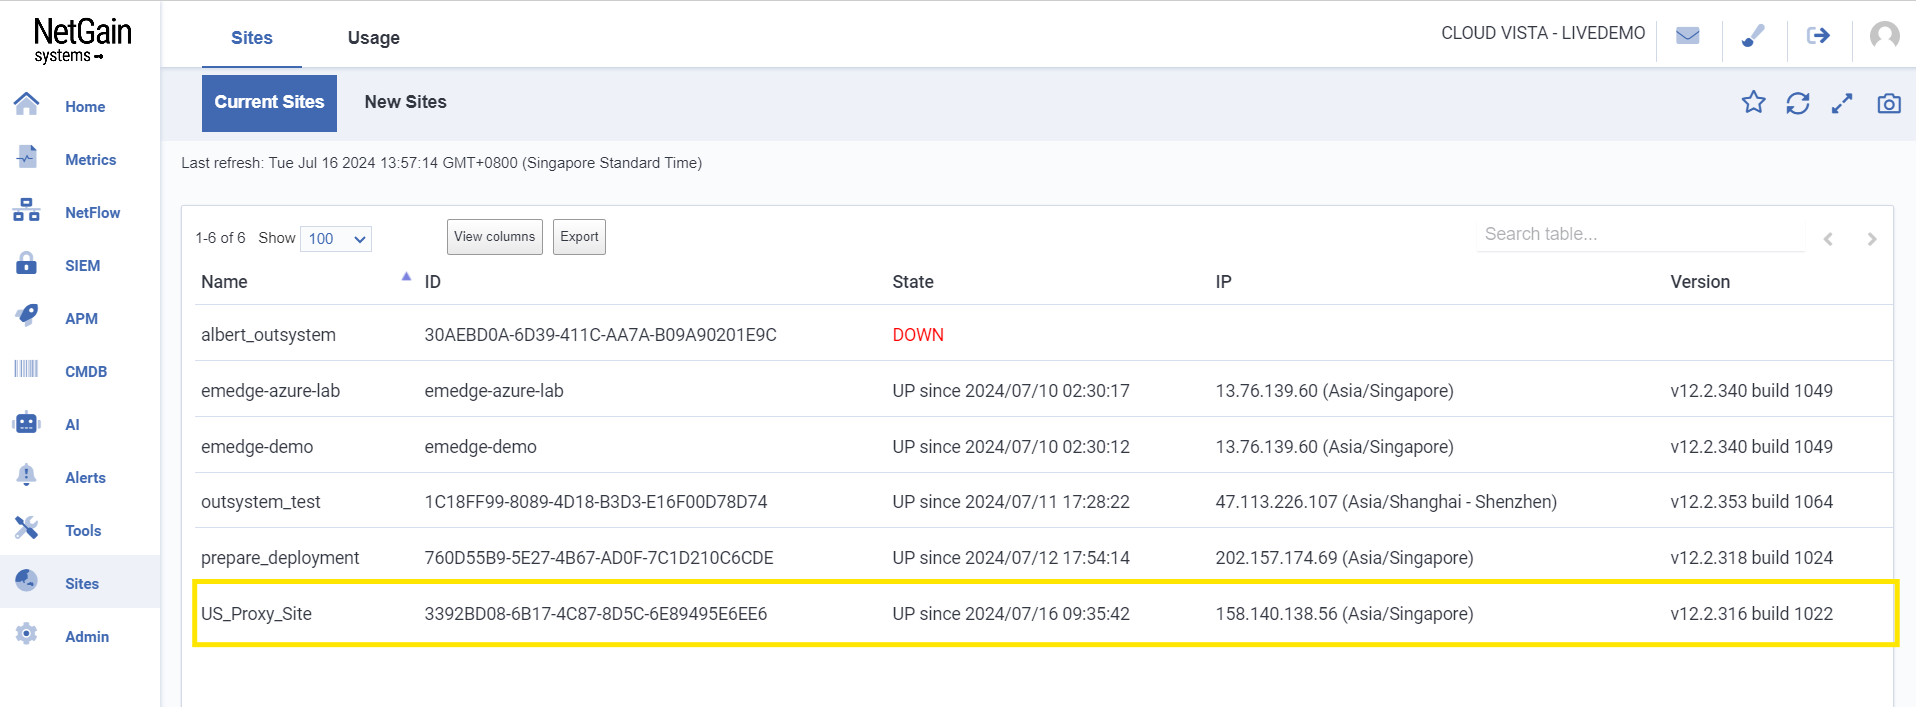
The ‘Current Sites’ tab displays sites that are being monitored by the system.
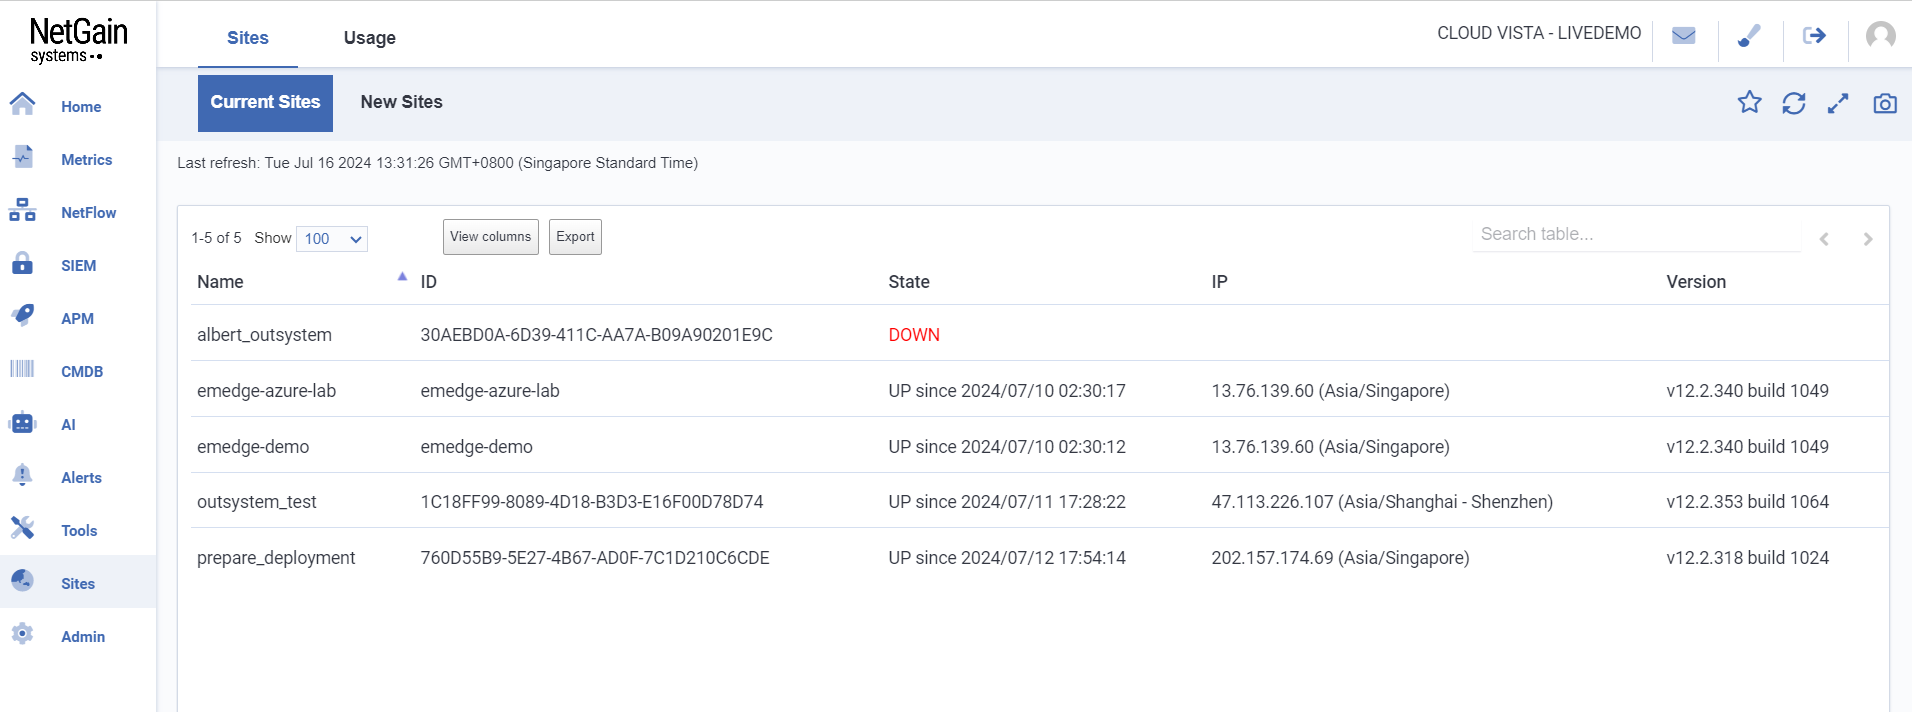 Basic information includes:
- Site Name
- Site ID
- State
- Site IP
- Site Version
View details of Sites
Click on the site name to view the details of the site.
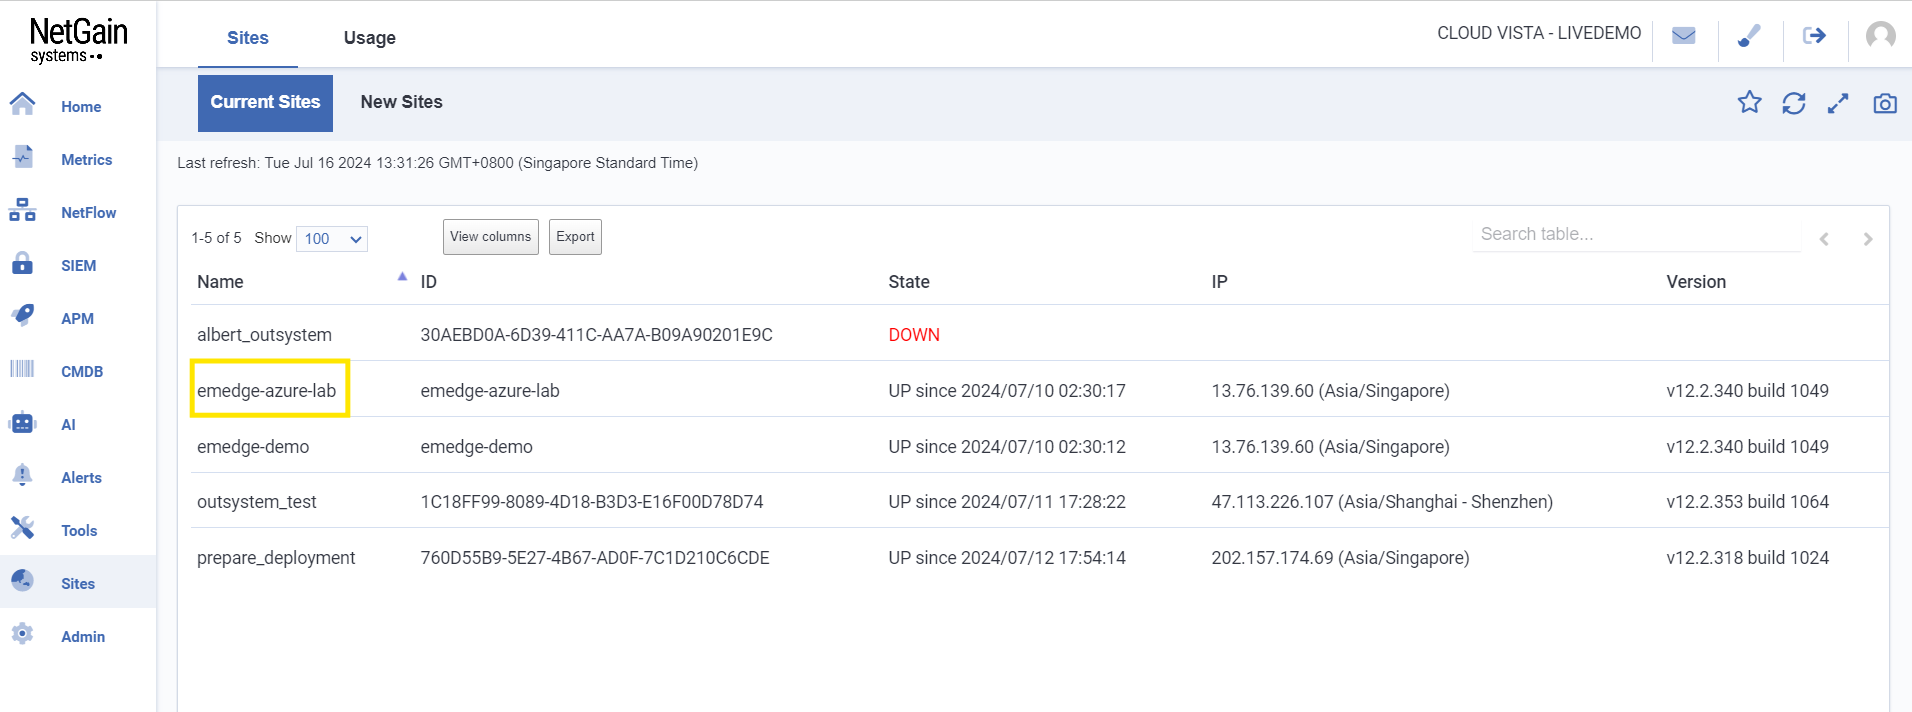
Once clicked, the page will navigate to the dedicated page of the selected site.
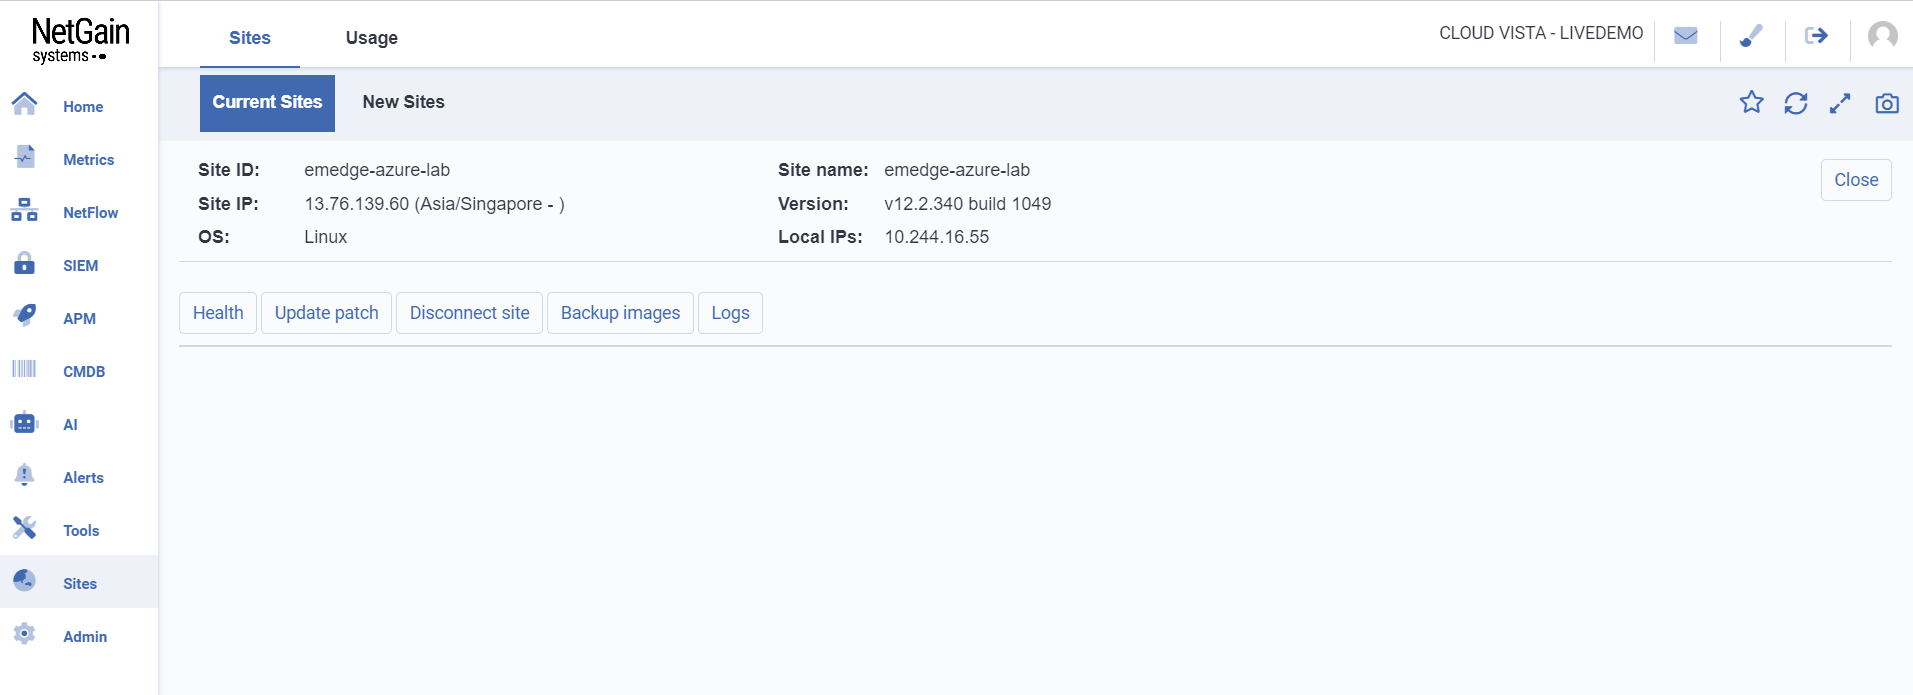
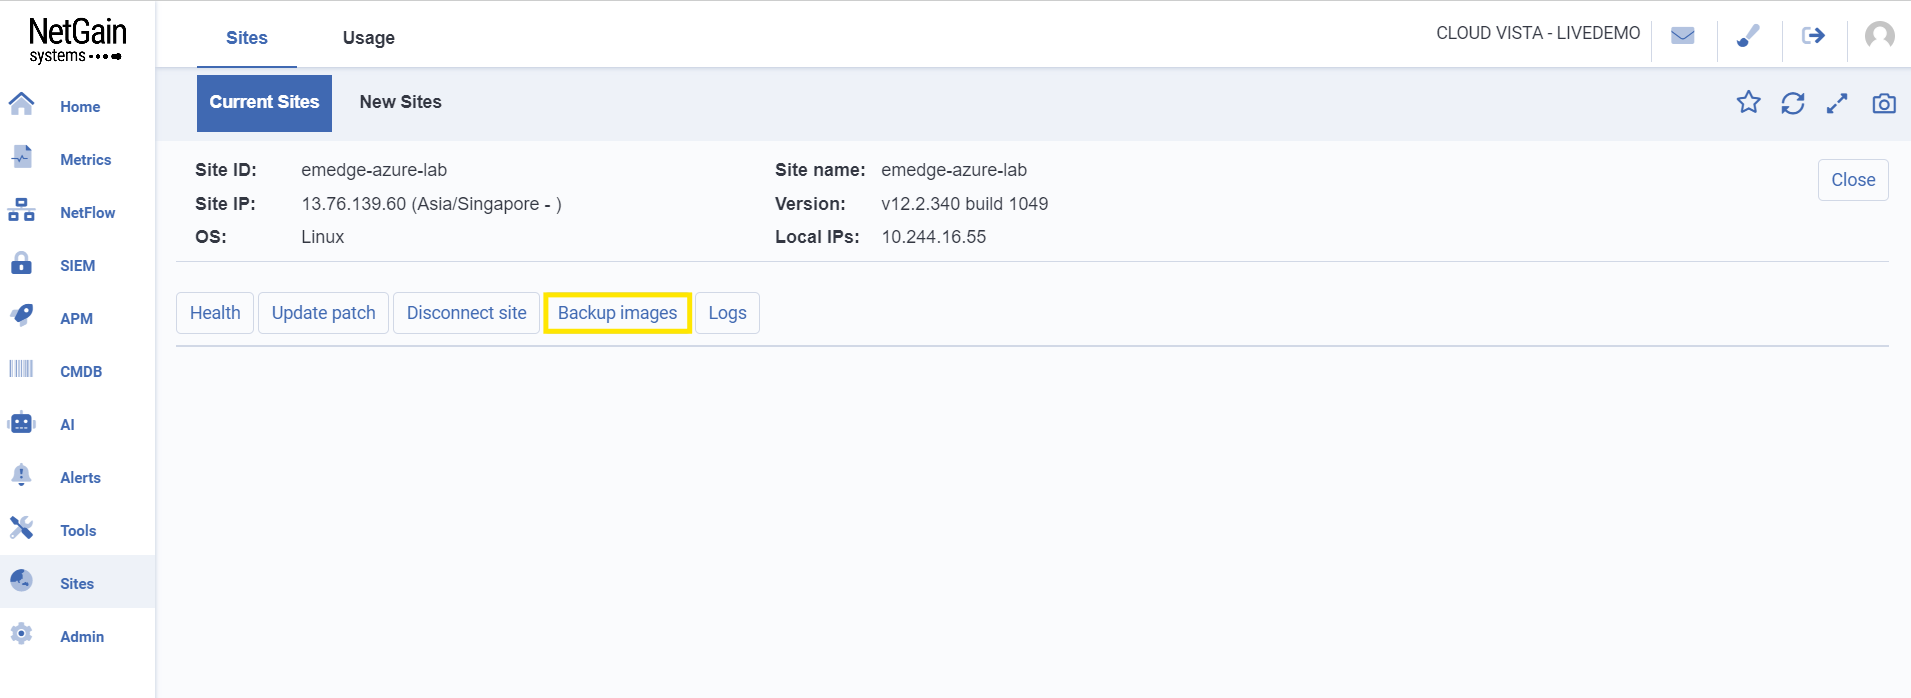
This page provides details of the site and options for:
- Site’s health
- Update patch
- Disconnect site
- Backup images and logs
Click on  to view the health of the site.
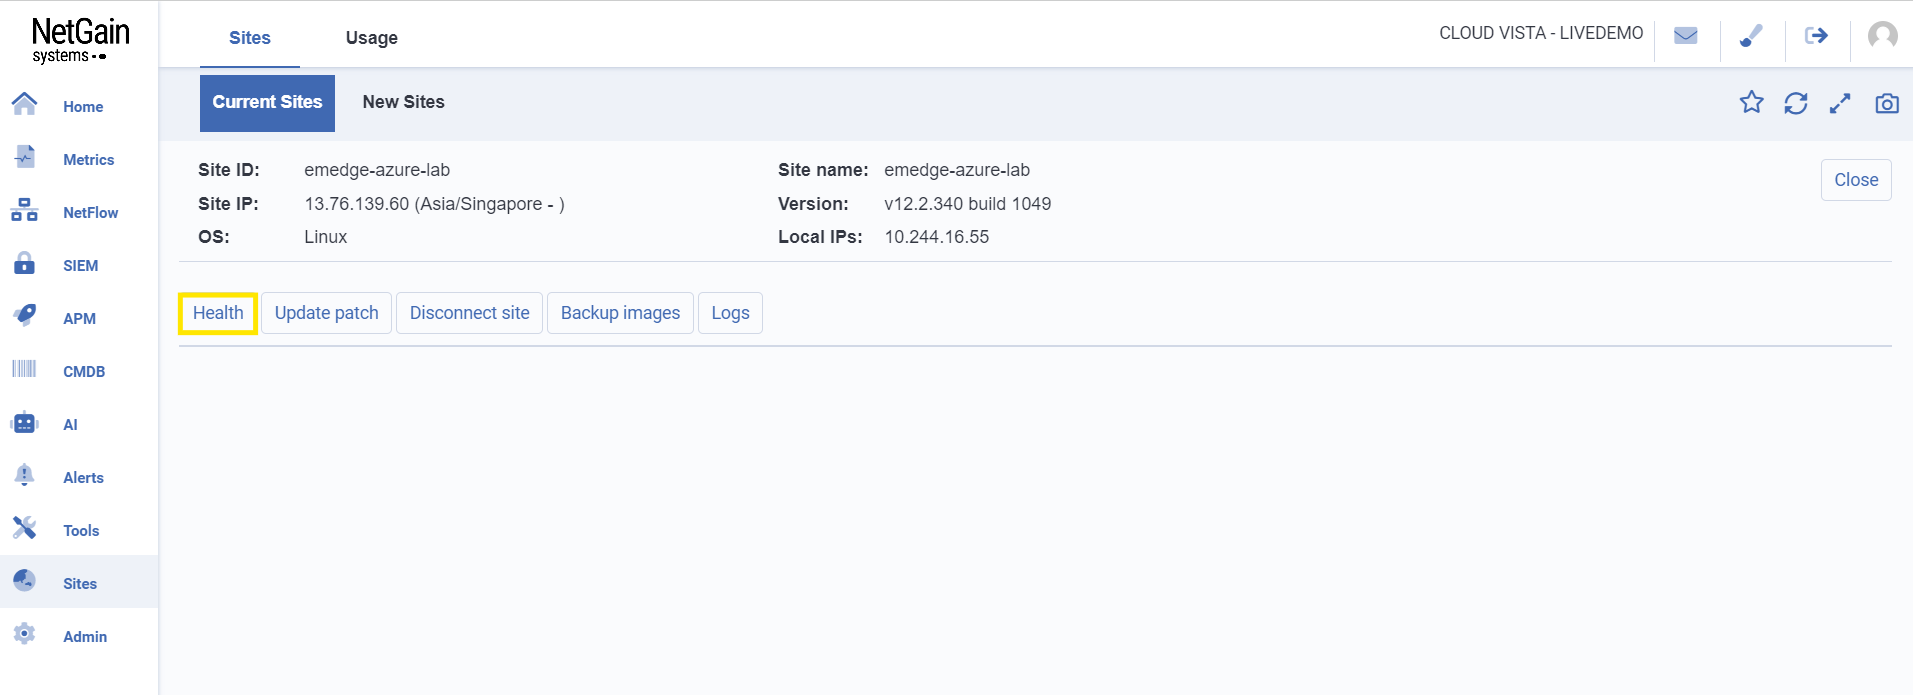
Once clicked, the page will display the health status of the site.
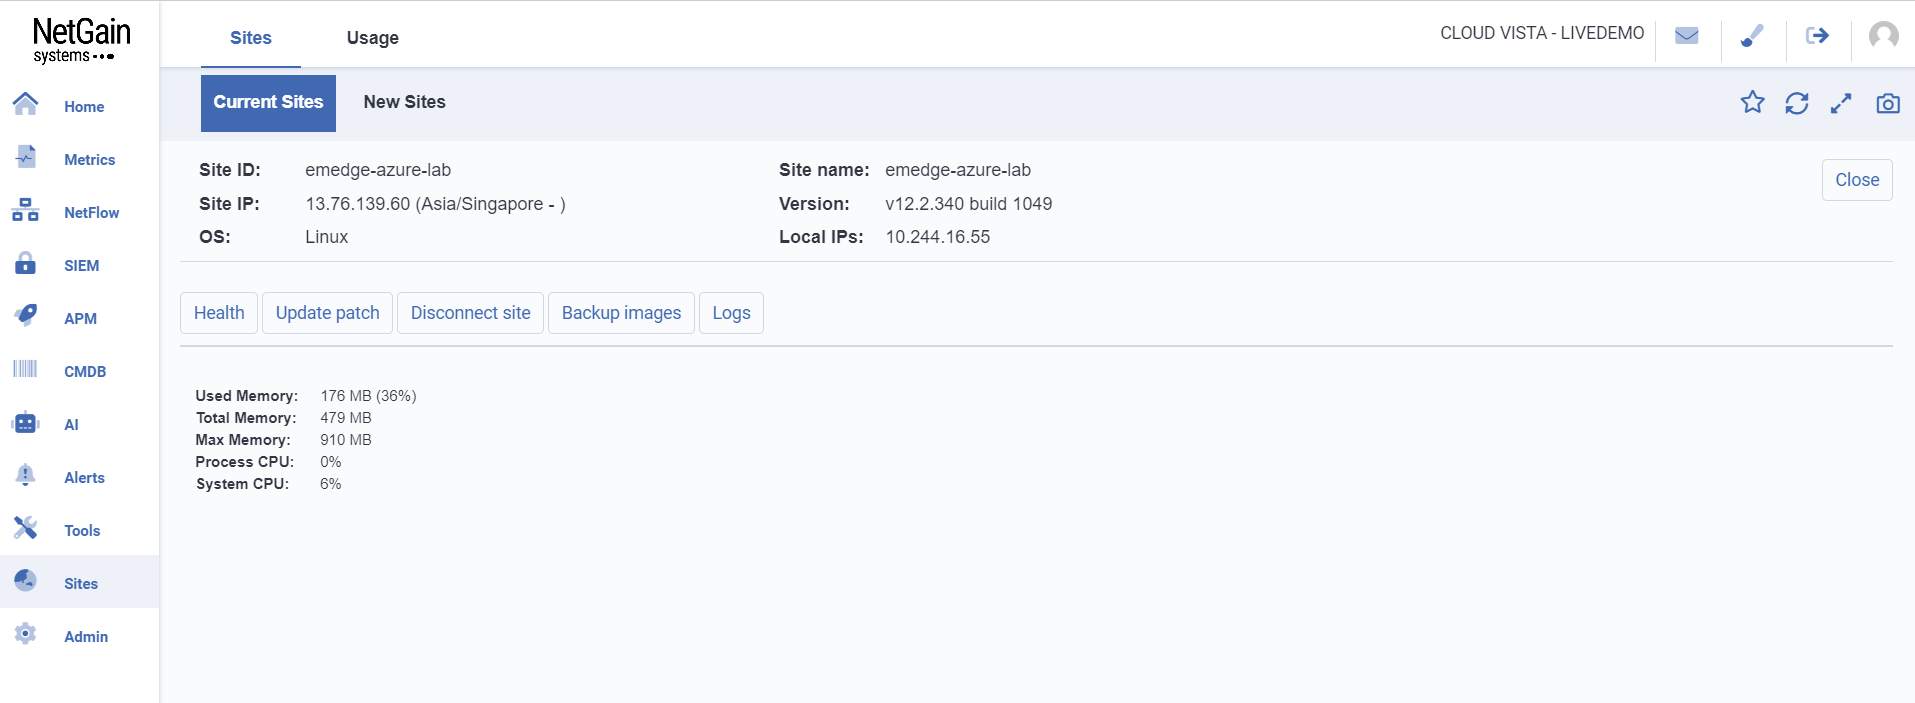
Information includes:
- Used Memory: Amount of memory currently used
- Total Memory: Total amount of memory available
- Max Memory: Maximum amount of memory that can be allocated
- Process CPU: CPU usage of the current process
- System CPU: Overall CPU usage of the system
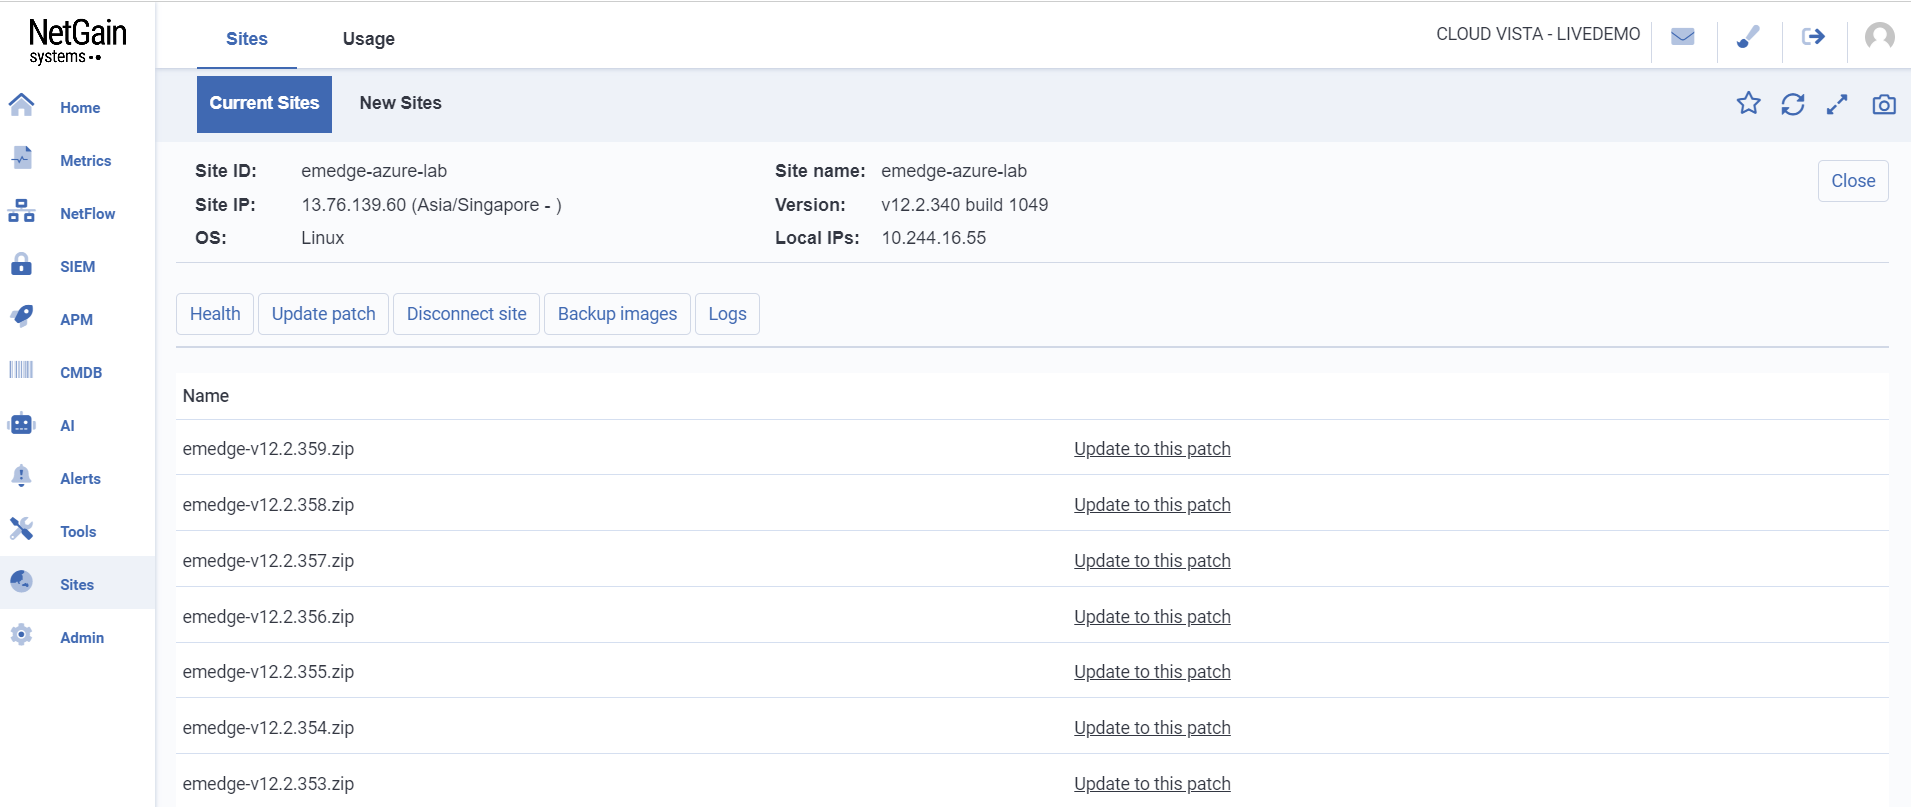
Click on  to view update patches.
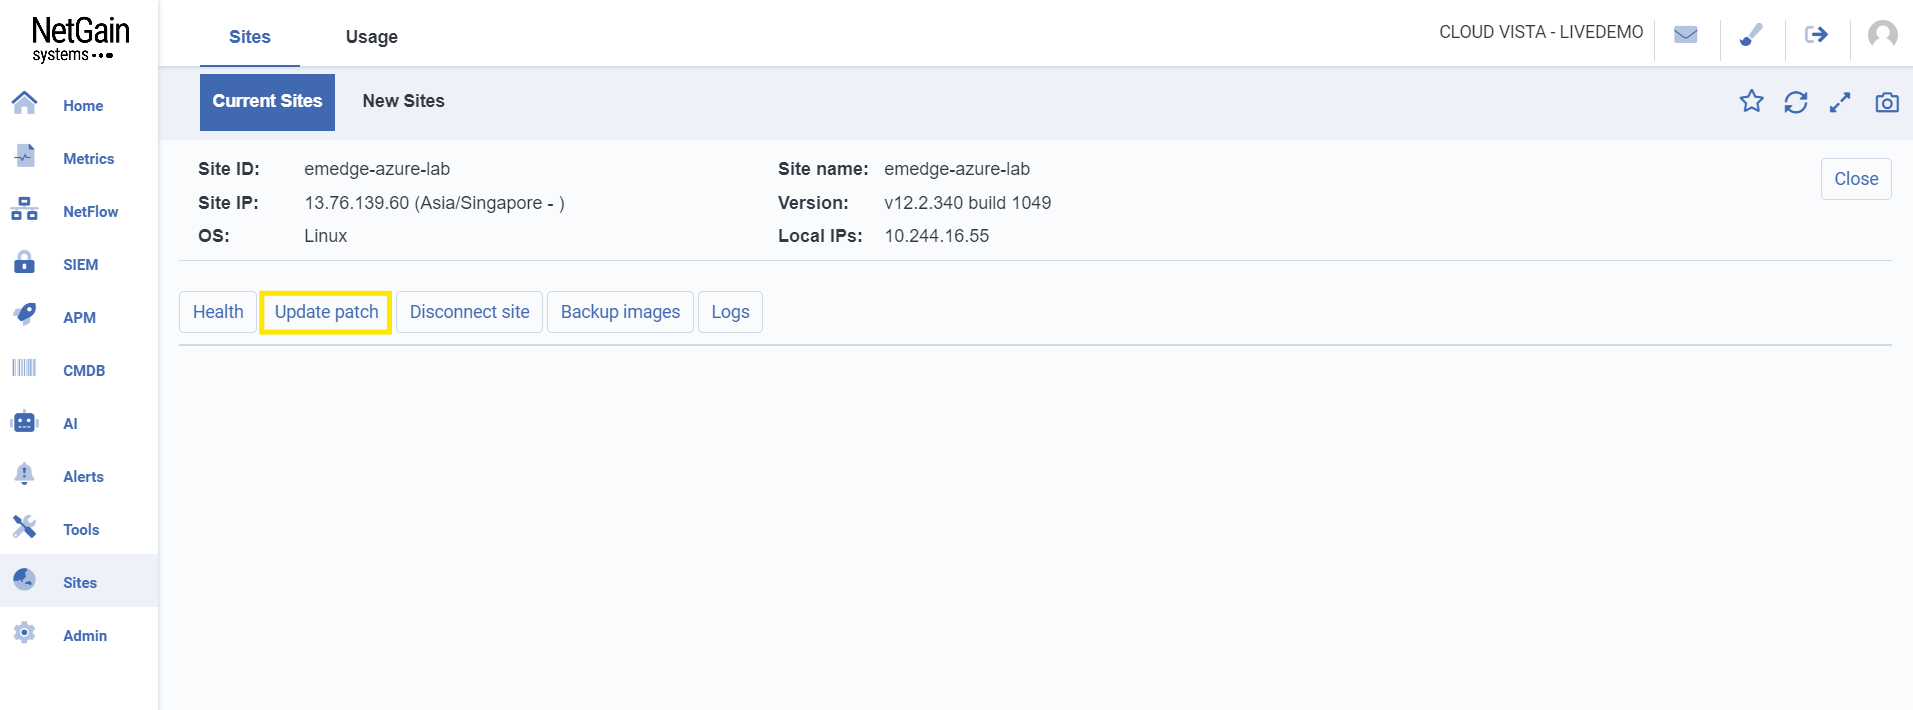
Once clicked, the page will display the available update patches.
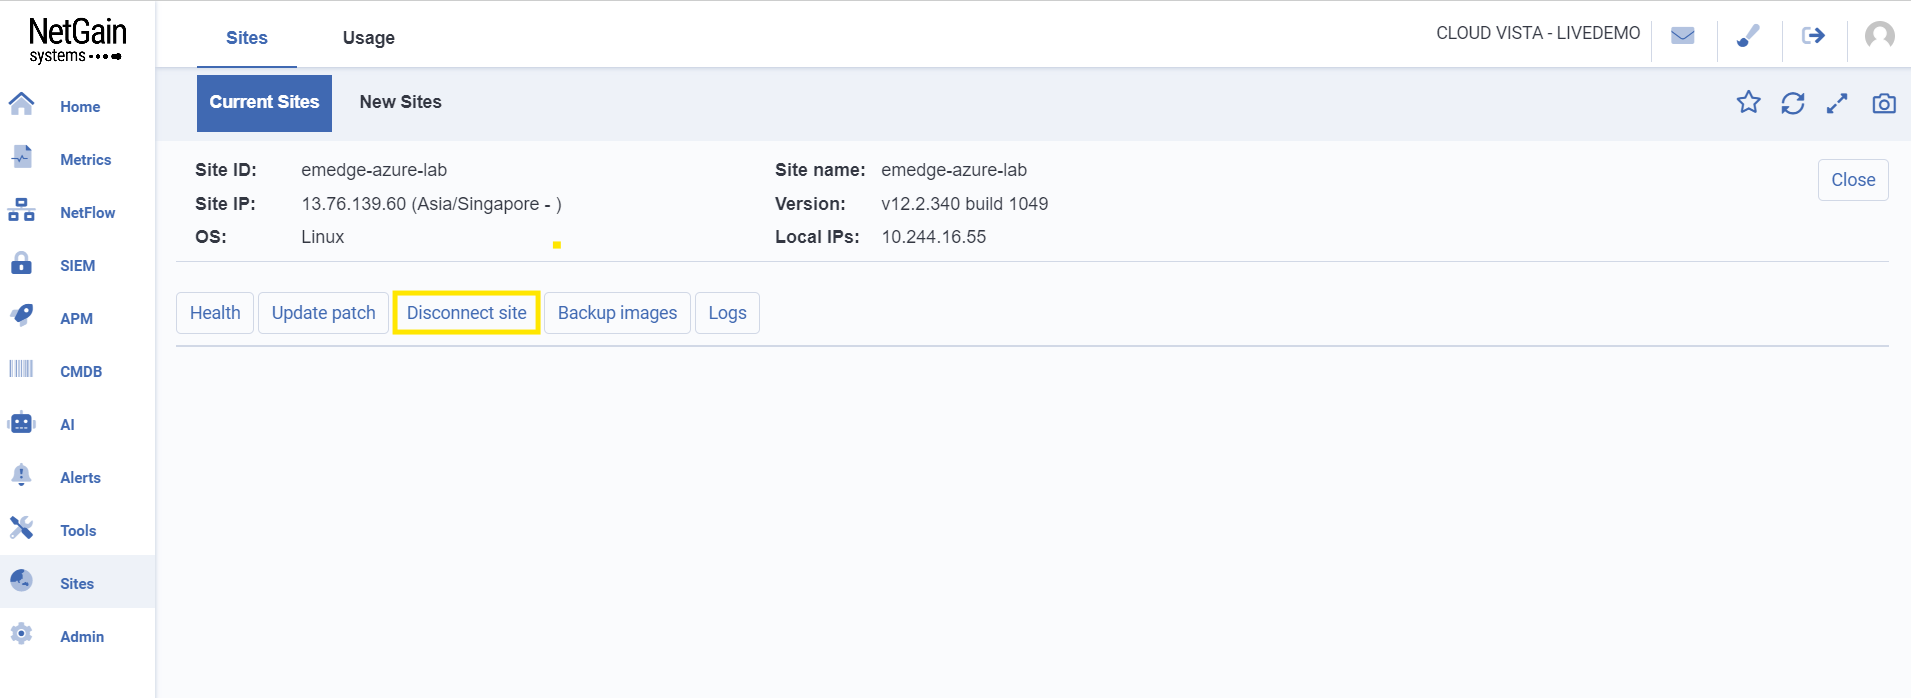
Click on  to disconnect the remote site.
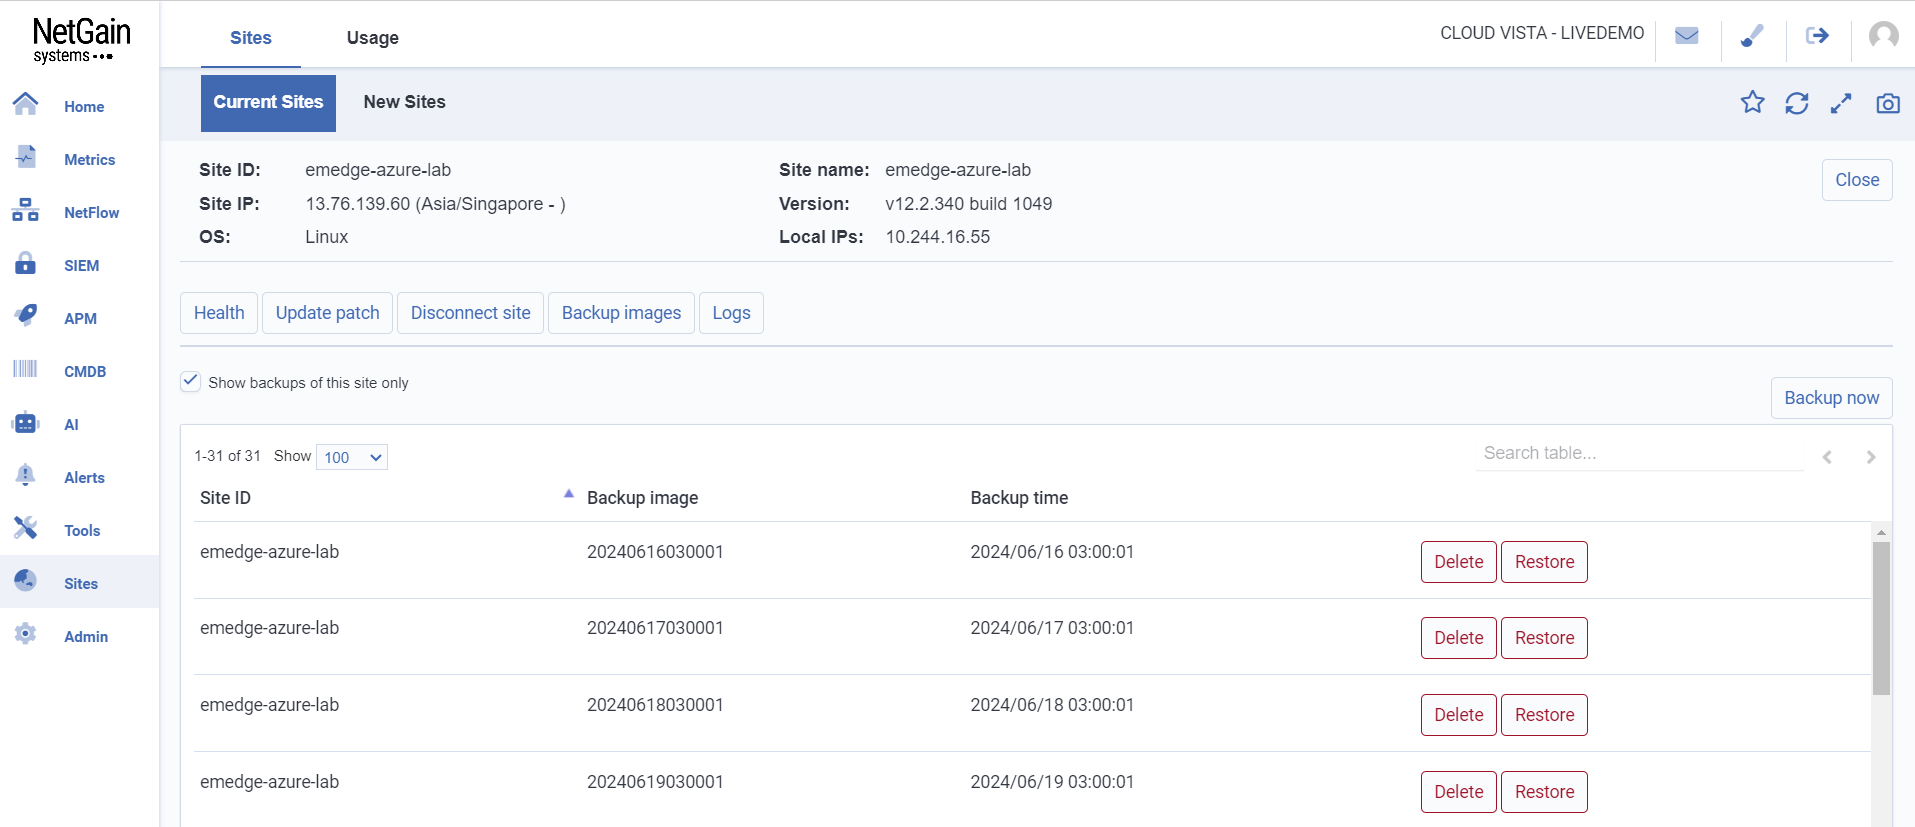
Click on  to make backups, delete, or restore.
Once clicked, the page will display sites with options to delete or restore and also backup now.
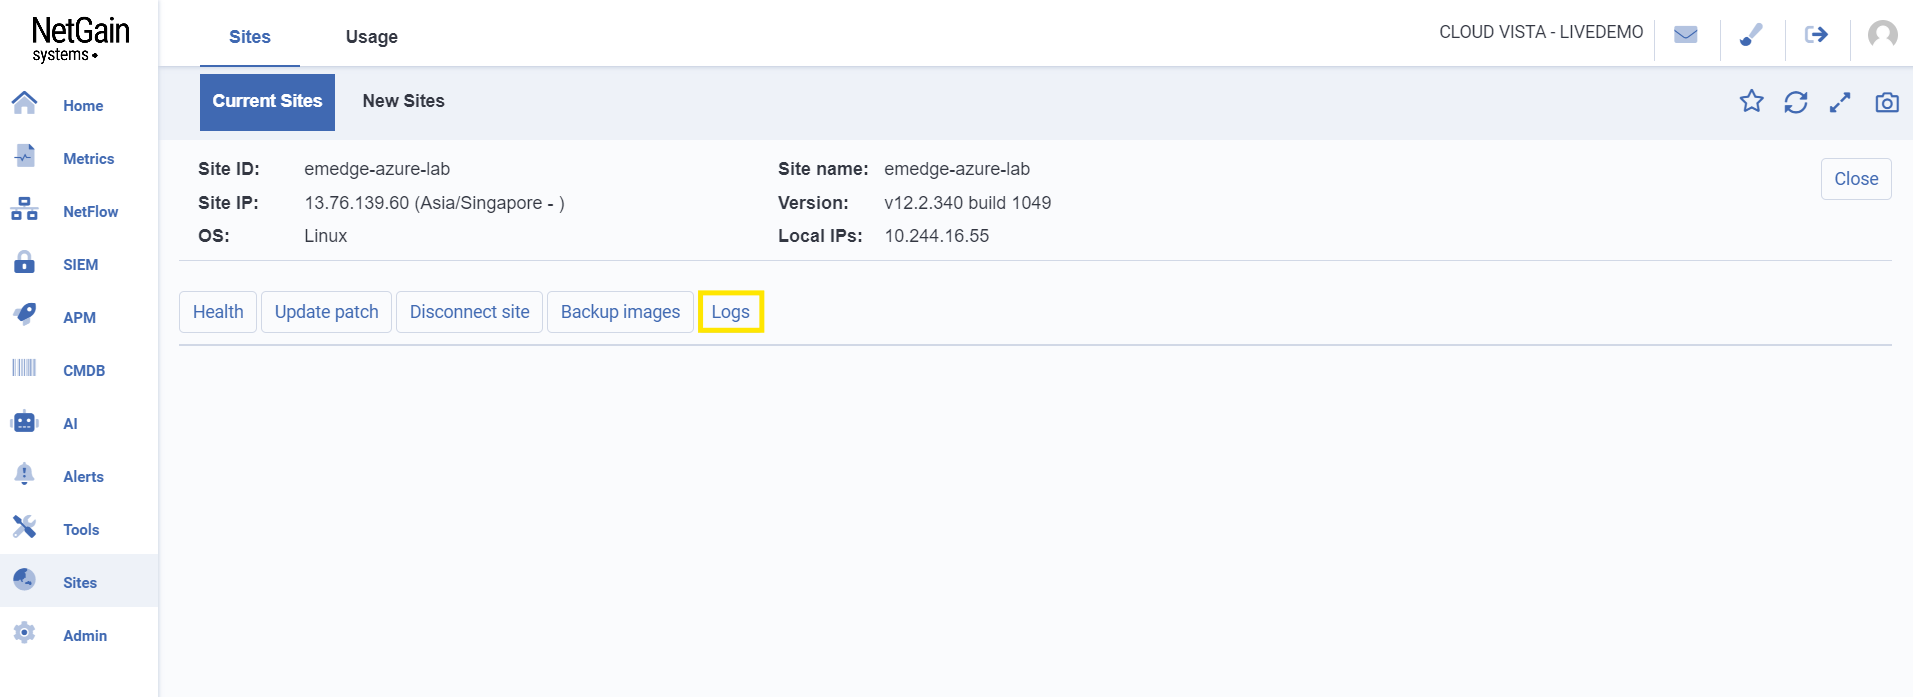
Click on  to download or tail logs or debug statements.
Once clicked, the page will display options to download the latest logs, tail logs, enable, or disable debug statements.
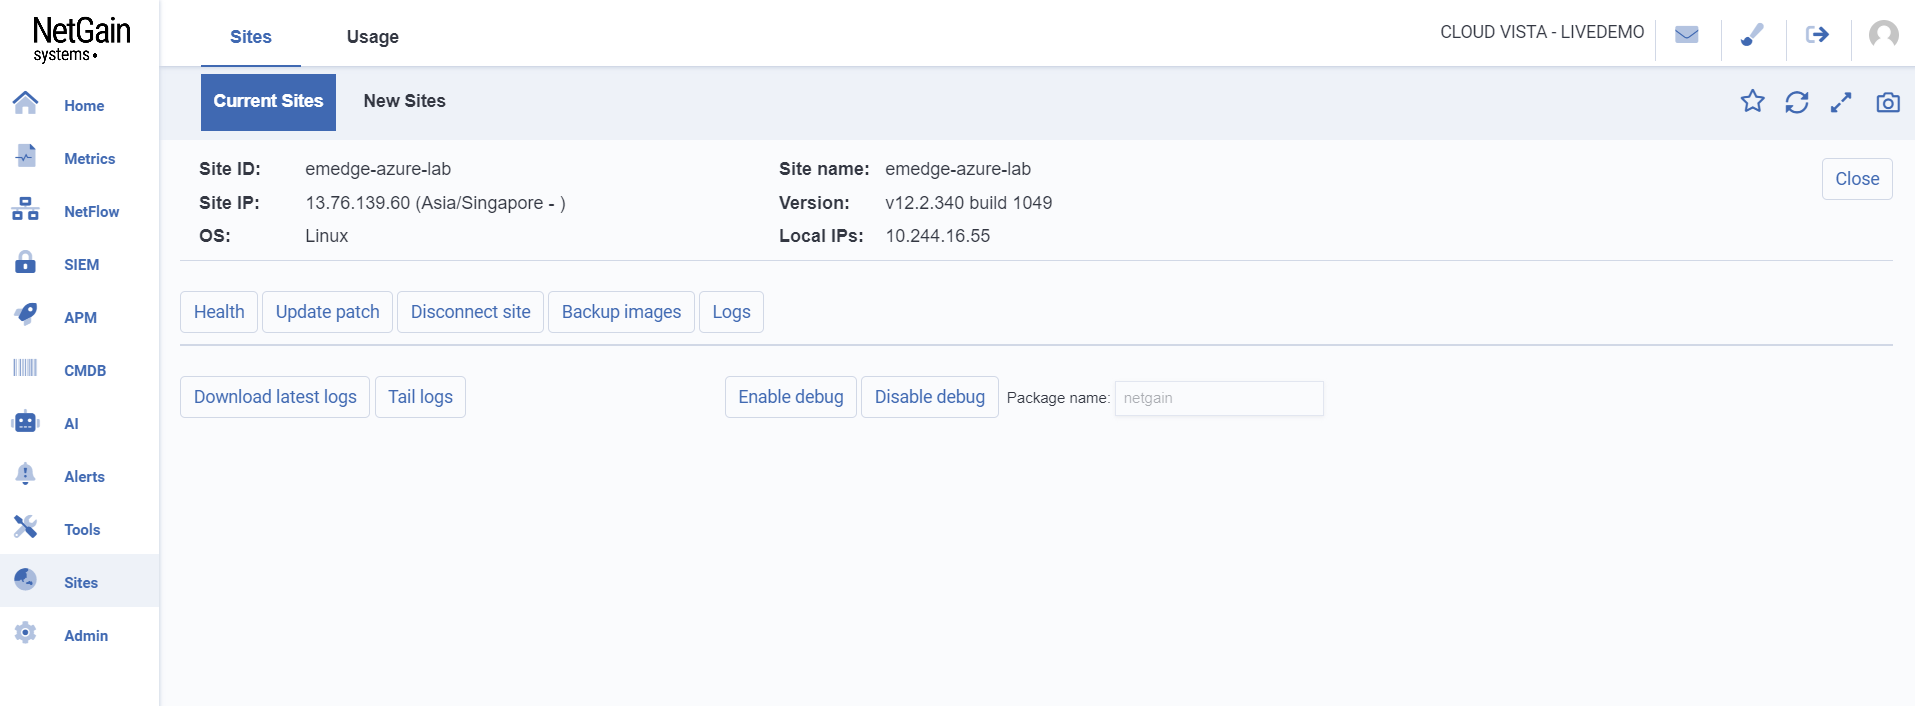
Enable Debug
To get the debug statement, click on
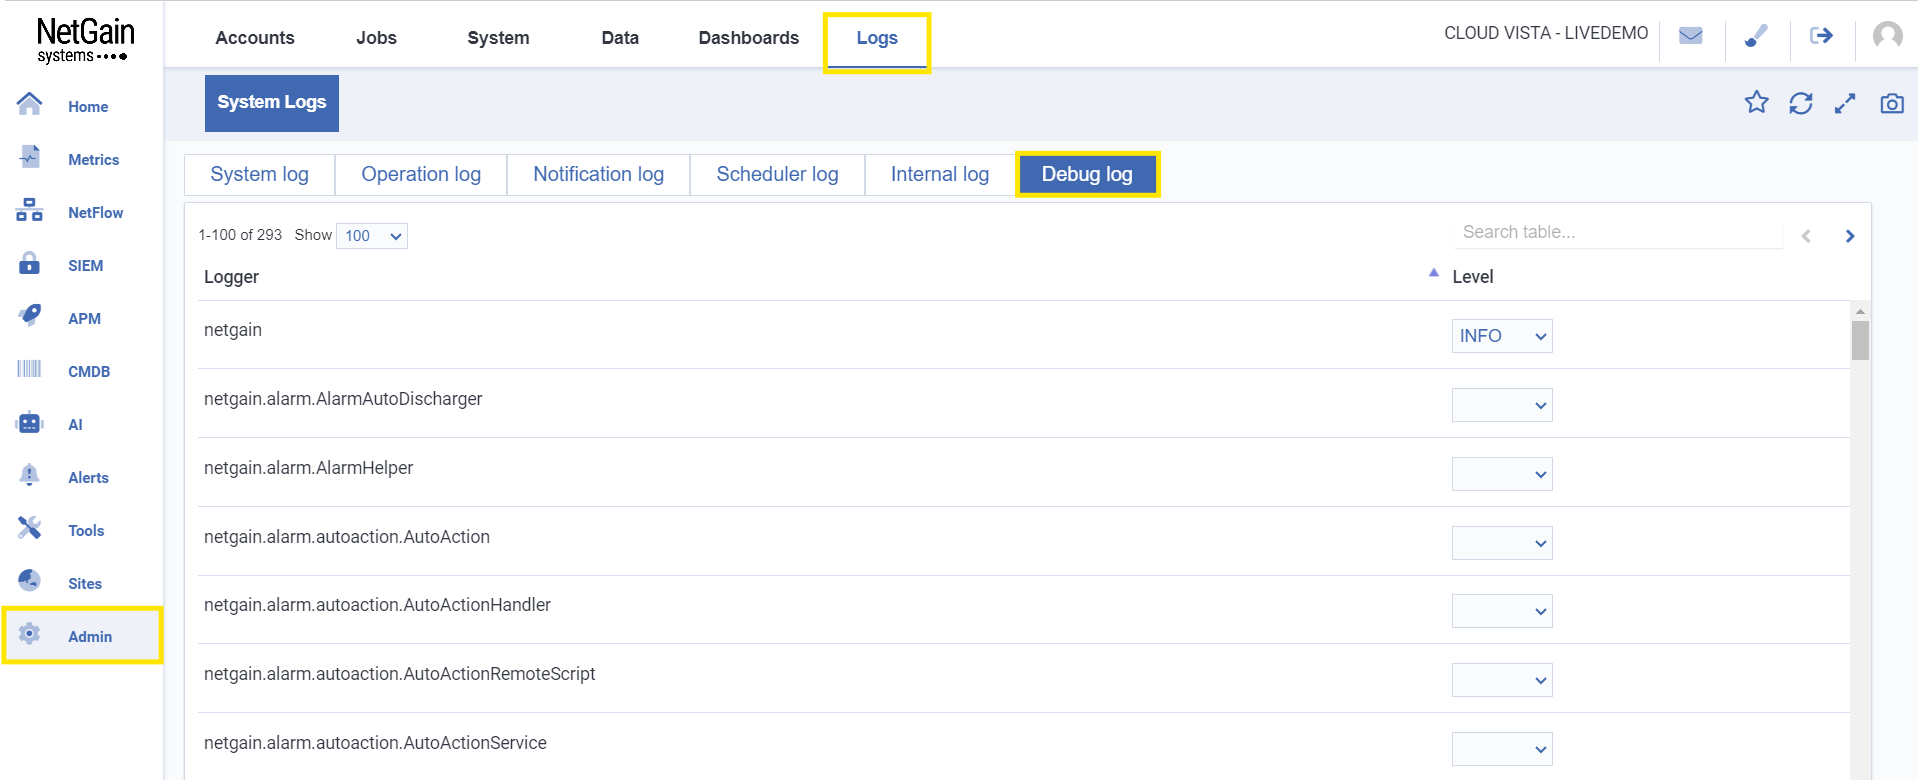
Copy the Logger.
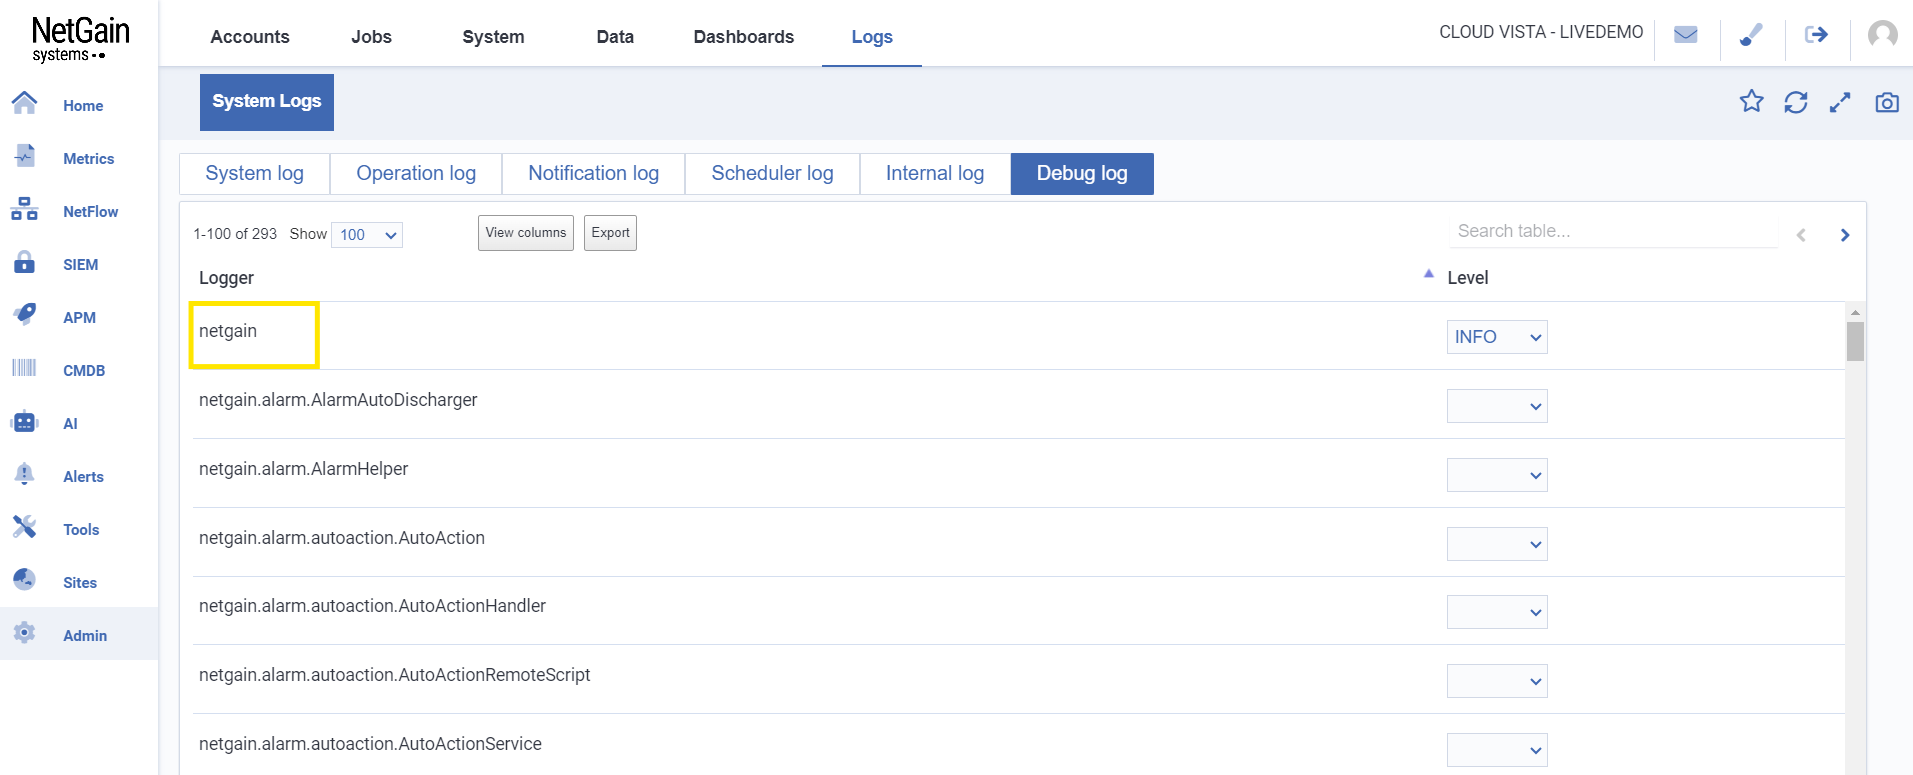
Paste into the package name and click on  .
.
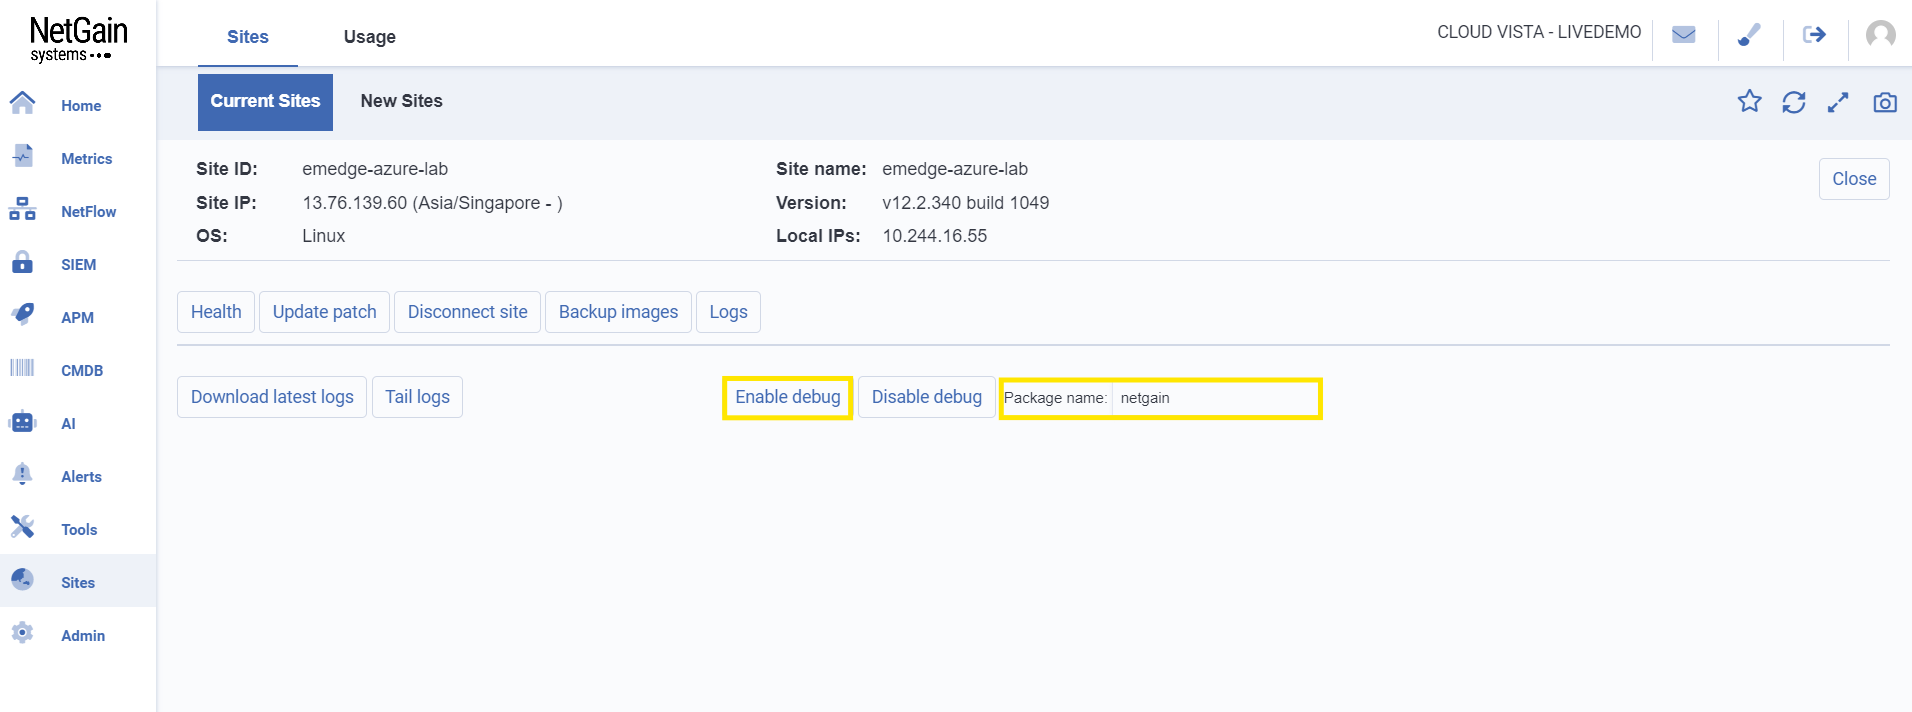
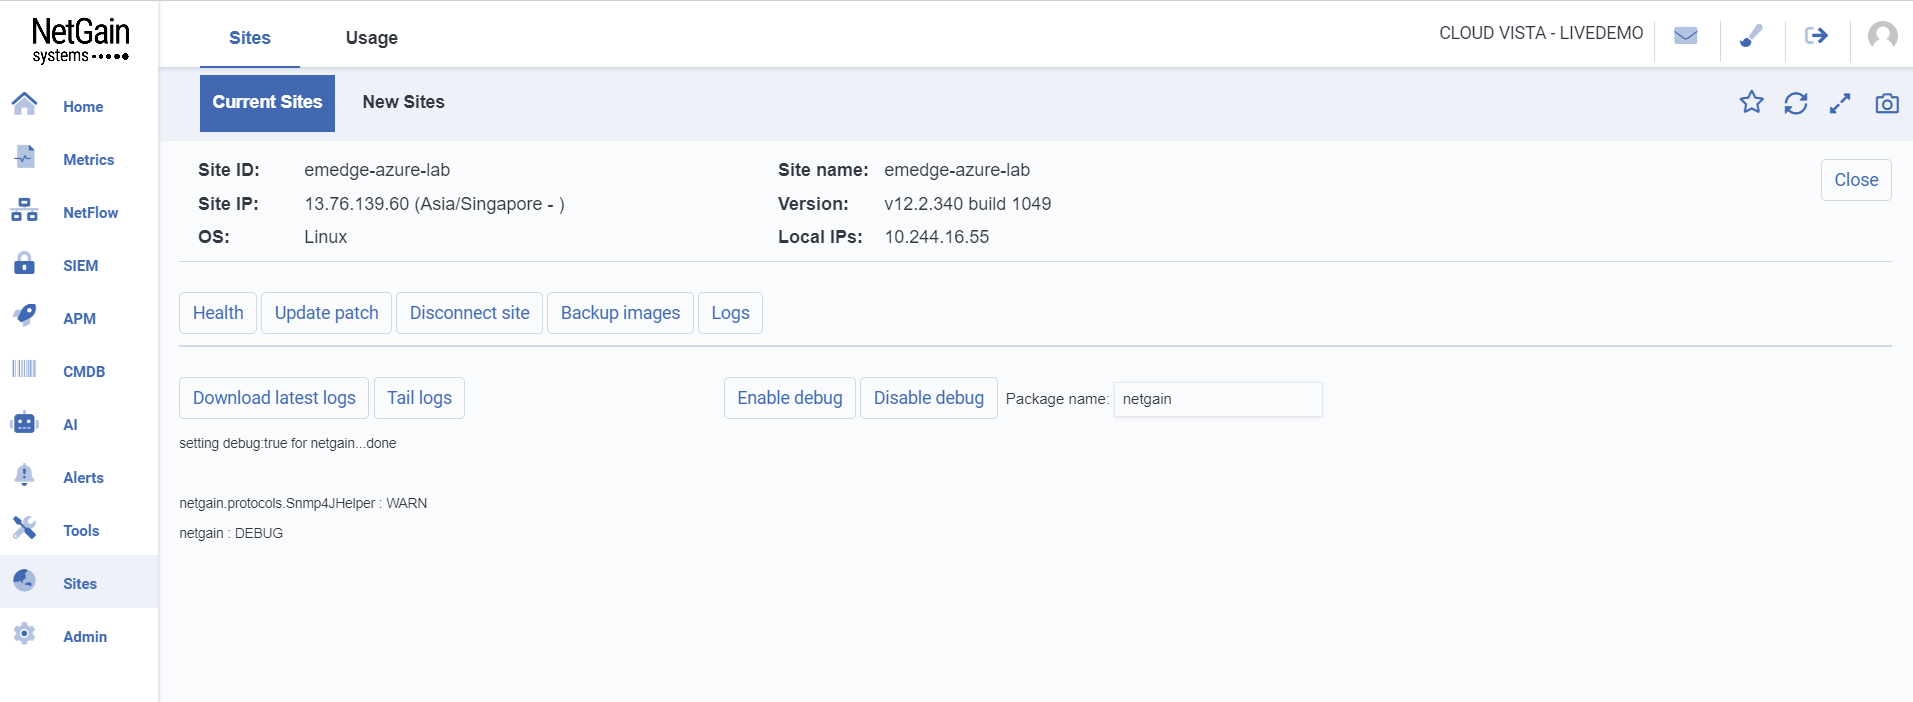
Successful enabling debug.
Accepting New Sites
Click on Site ID to view details of the site.
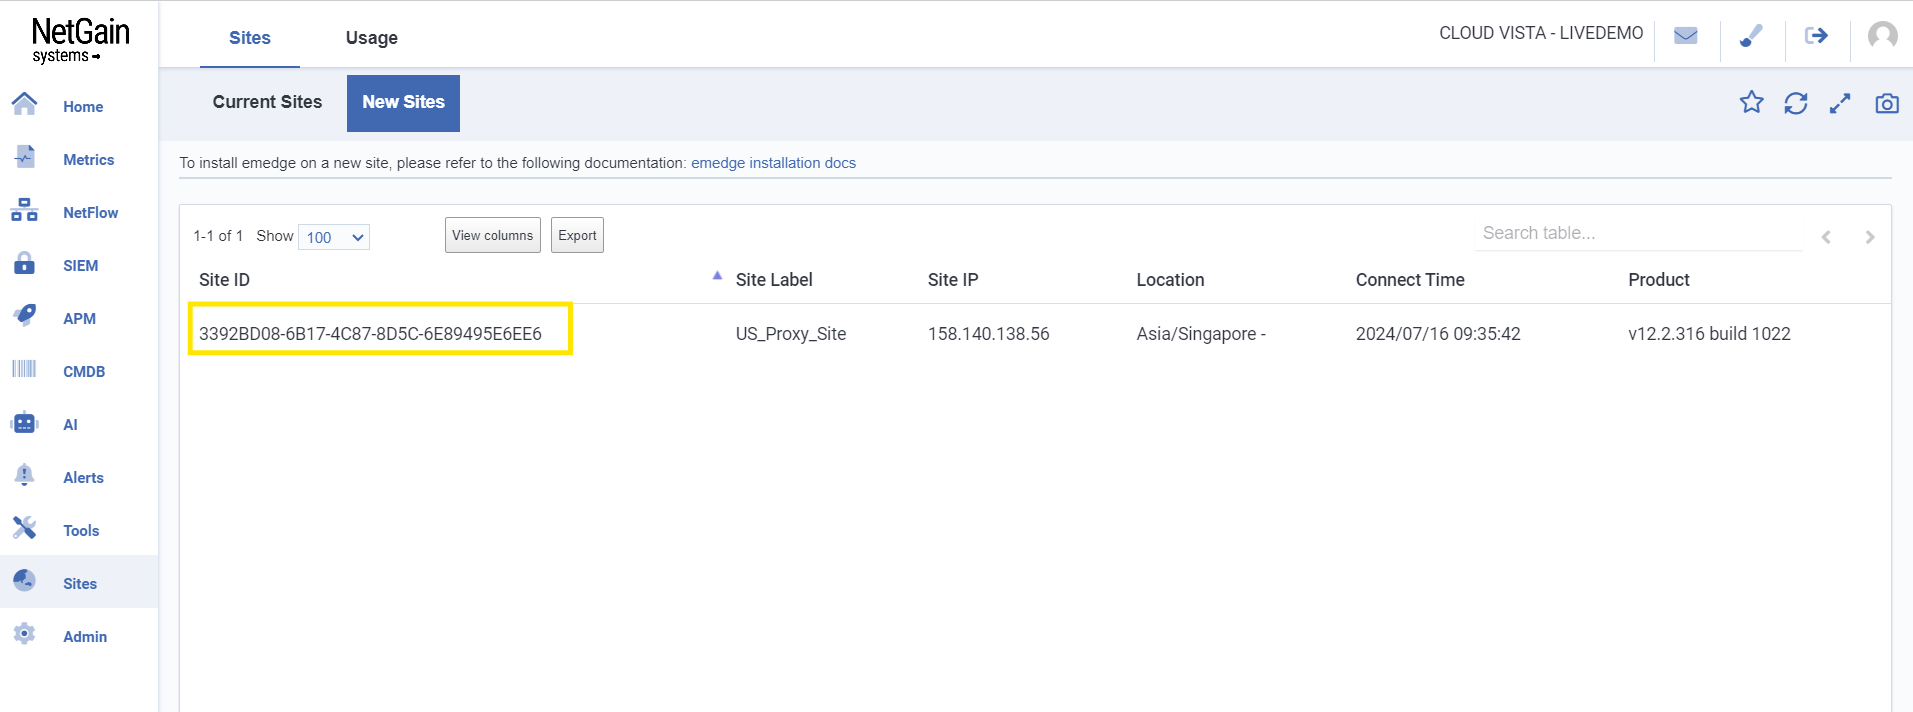
Once clicked, the page will navigate to the dedicated page of the selected site.
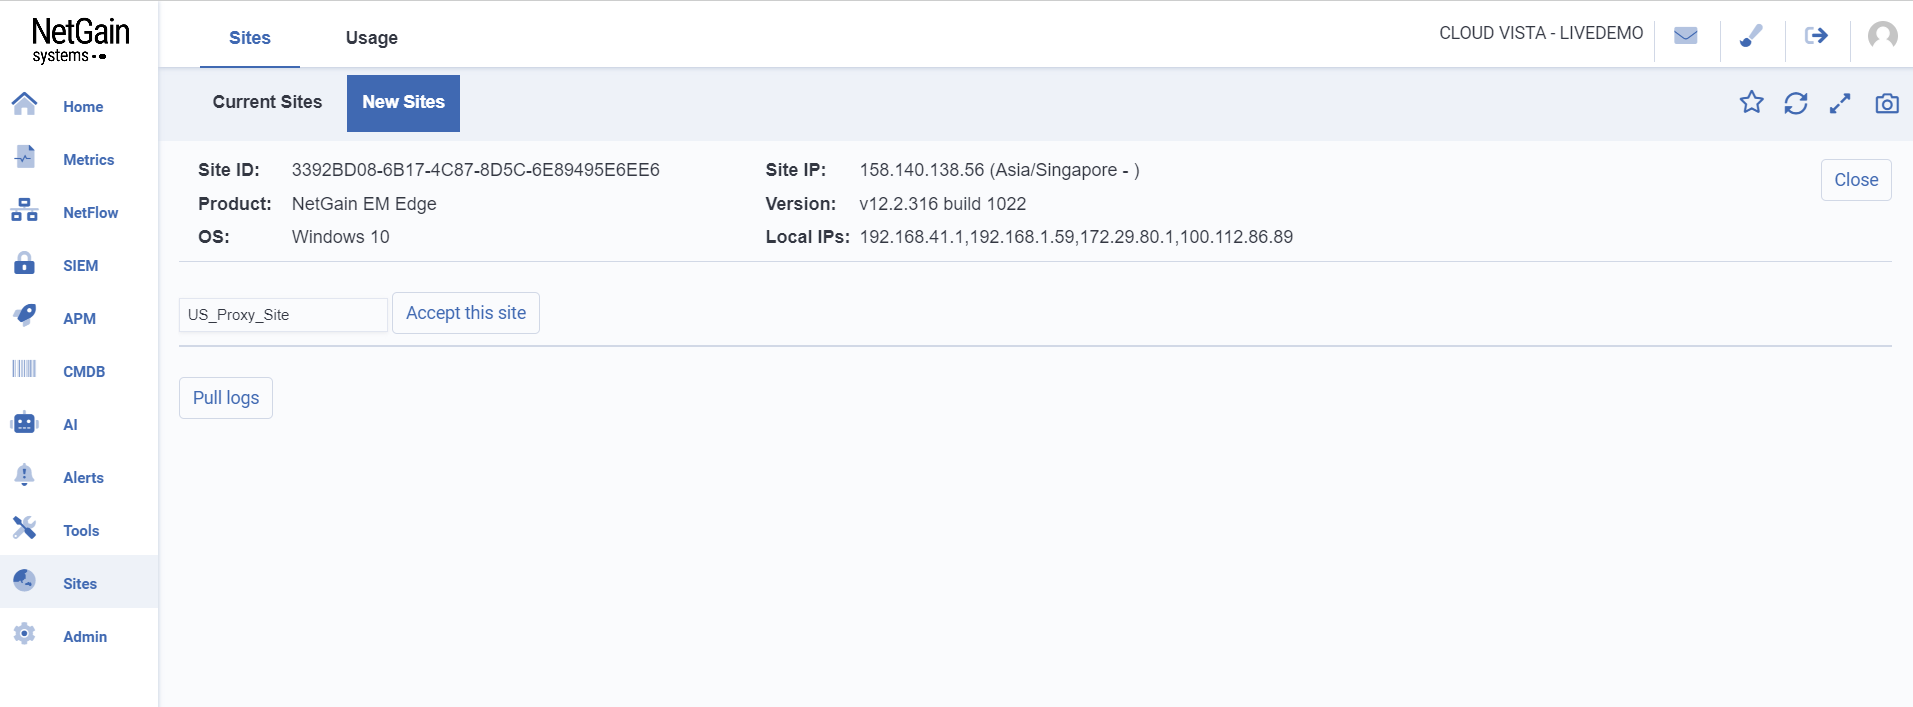
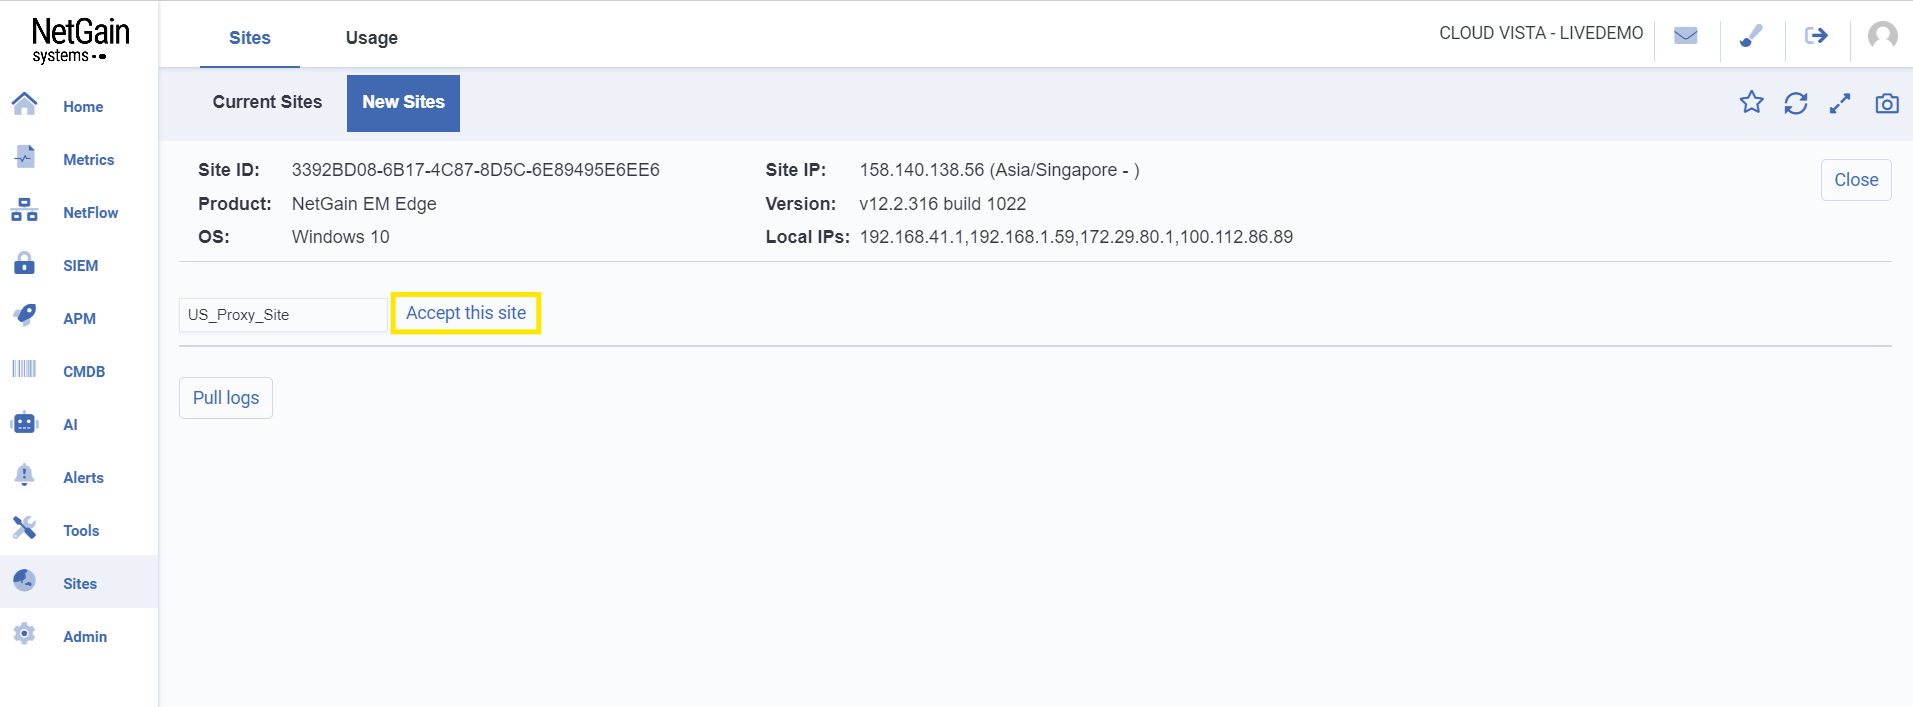
Click on  to accept the site.
Successful site acceptance.
The ‘Usage’ tab displays a view of the usage metrics for different aspects of the monitoring platform.
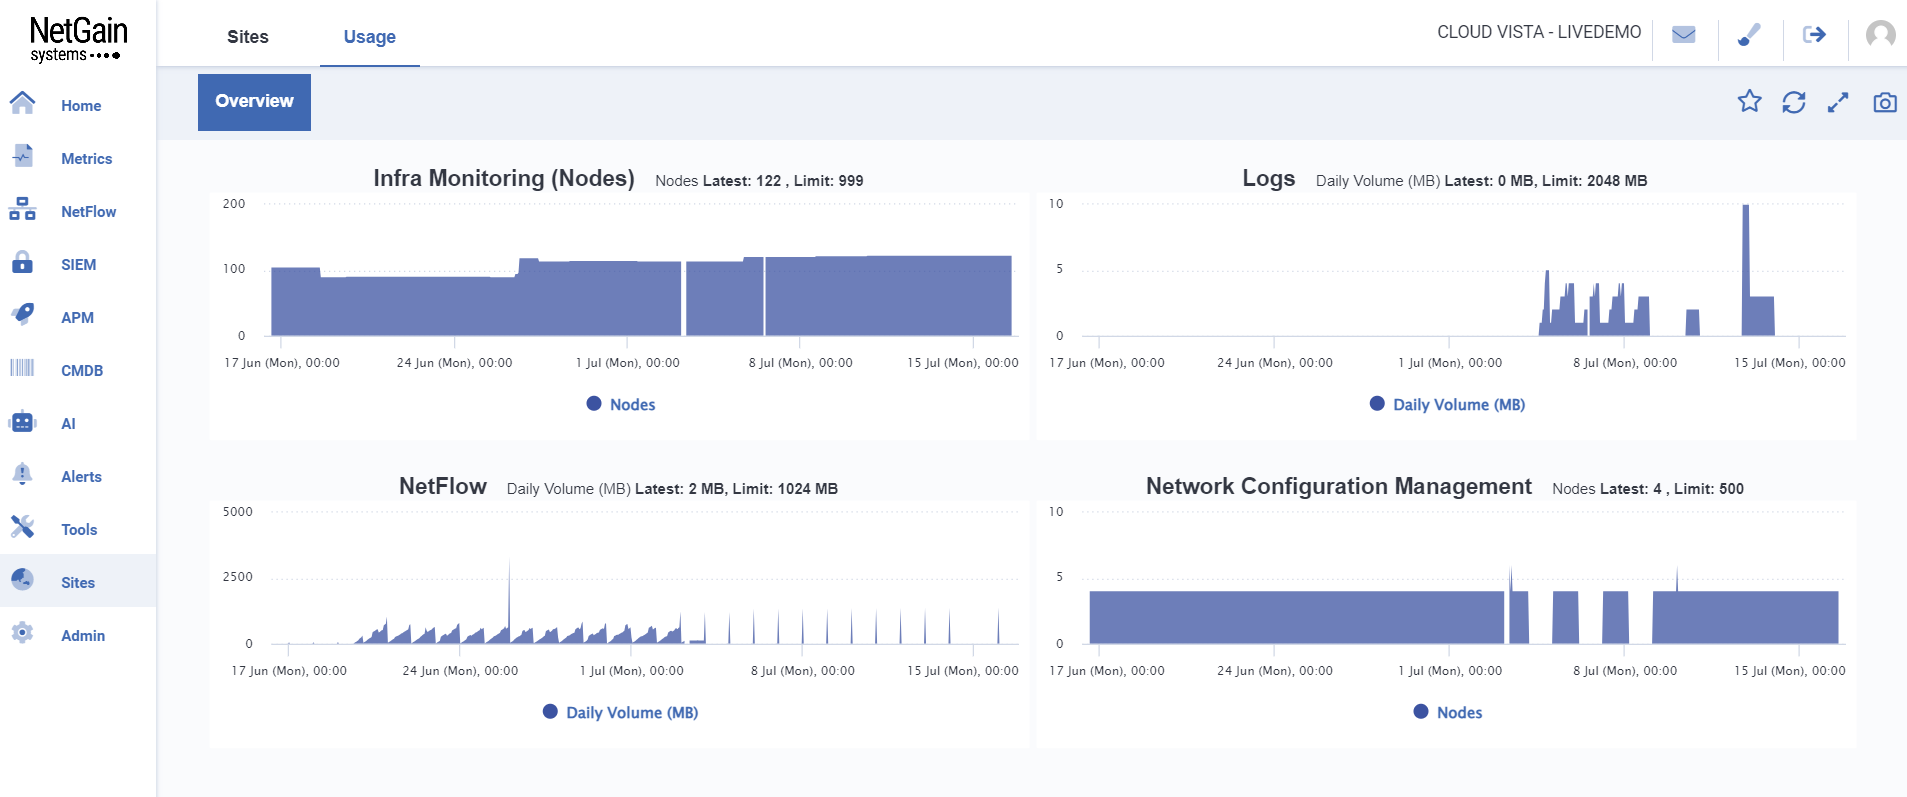
Information includes:
- Infra Monitoring (Nodes): Bar chart showing the number of nodes being monitored over time
- Logs: Bar chart showing the daily volume of logs in megabytes
- NetFlow: Bar chart showing the daily volume of NetFlow data in megabytes
- Network Configuration Management: Bar chart showing the number of nodes involved in network configuration management
- Application Performance Monitoring: Bar chart showing the daily transaction spans